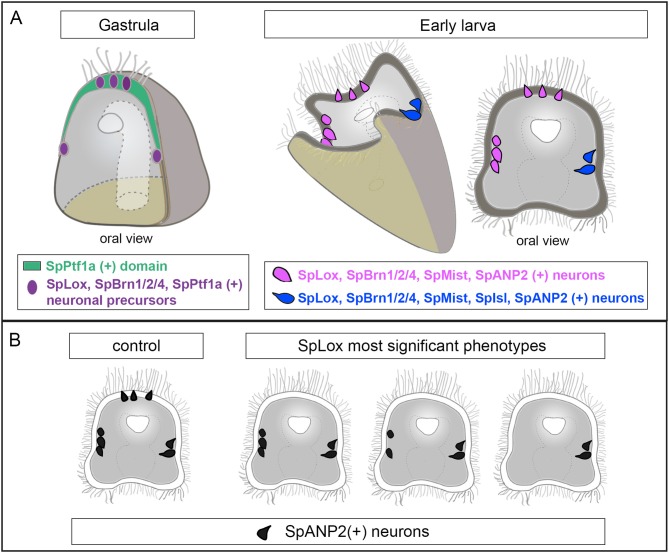
Figure 6.
Summary of the regulatory state of the SpLox+ neurons. (A) Schematic representation of a sea urchin gastrula (left) and early larva (right) showing the neurons identified in this study. Neurons with the same pancreatic signature have the same color. (B) Cartoon showing decrease in SpANP2+ neurons in SpLox morphants. The three most frequent phenotypes are shown.

