Figure 1.
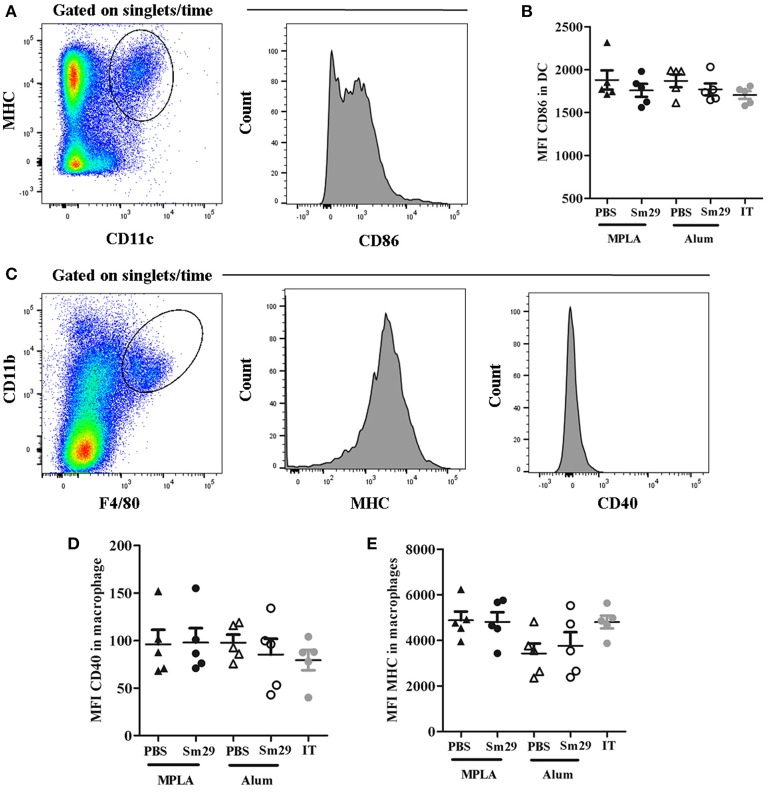
Activation status of dendritic cells (DC) and macrophages. Spleen from 5 to 6 animals was obtained for each group. Dendritic cells and macrophages were labeled to evaluate the expression of activation markers. For dendritic cells analysis, CD11c+ and MHC+ double positive cells were selected and the mean fluorescence intensity (MFI) of CD86 was determinate (A). For macrophages, F4/80 and CD11b double positive cells were selected and the mean fluorescence intensity of MHCII and CD40 were evaluated (C). Data of CD86 MFI in dendritic cells (B), MHCII MFI (D) and CD40 MFI (E) in macrophages from animals of MPLA (closed triangles), Sm29 MPLA (closed circles), Alum (open triangles), Sm29 Alum (open circles) and infected/treated (gray circles) groups are represented on graphics. Results are representative of one from two independent experiments.

