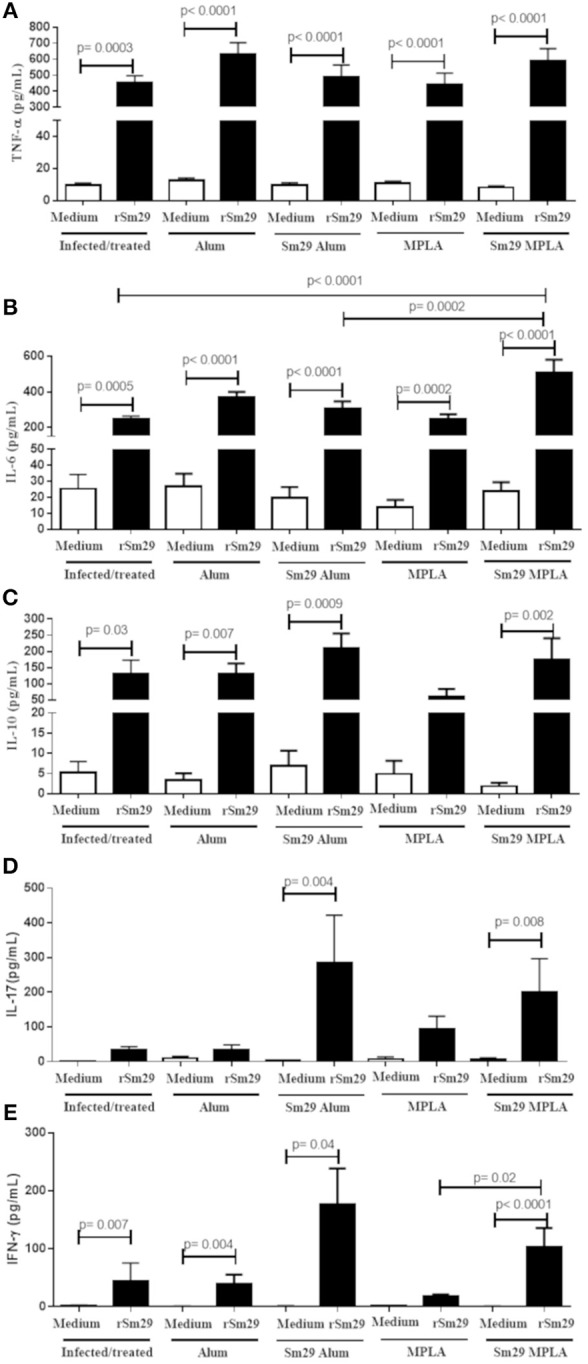
Figure 3.

Cytokine production by spleen cells culture of immunized mice. Spleen from animals of MPLA (n = 11); Sm29 MPLA (n = 14); Alum (n = 11), Sm29 Alum (n = 15) and Infected and treated (n = 11) groups were obtained. Spleen cells cultured with (black bars) or without (open bars) rSm29 (25 μg/mL) stimulation was assessed to determine cytokine production. The levels of TNF-a (A), IL-6 (B), IL-10 (C), IL-17 (D), and IFN-γ (E) were measured by the CBA Th1/Th2/Th17 Kit. Statistically significant differences are denoted on the graphics. Bars represents the mean + SD values of three independent experiments.
