Figure 5.
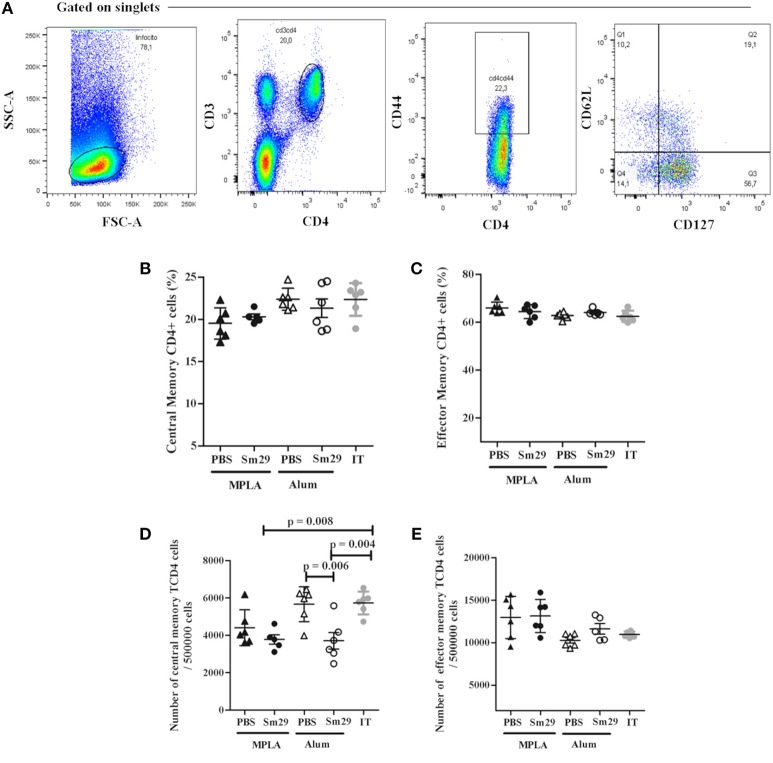
Frequency of T memory cells in immunized mice. Spleen from 5 to 6 animals was obtained for each group to determine the frequency of T memory cells. Data analysis was carried out as demonstrated (A): within singlet cells/lymphocyte population, CD4+CD44high cells were selected and, within that population, the percentage of CD127+CD62low cells representing CD4+ T effector memory cells, CD127+CD62high population representing the CD4+ T central memory cells were determined. Data represents percentage and number of CD4+ T central memory cells (B,D) effector memory cells (C,E) in animals from MPLA (closed triangles), Sm29 MPLA (closed circles), Alum (open triangles), Sm29 Alum (open circles) and infected/treated (gray circles) groups. Results are representative of one from two independent experiments.

