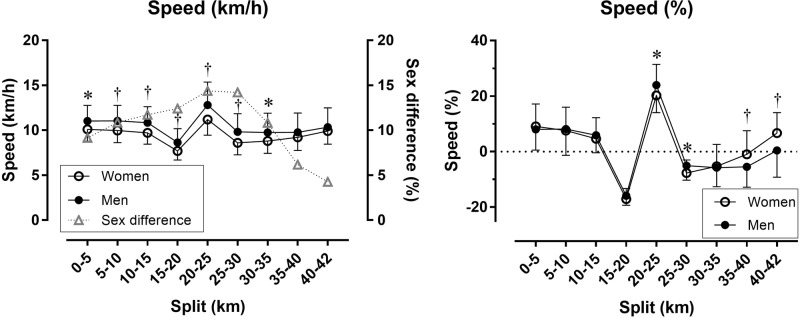
FIGURE 2.
Race speed in absolute (left) and relative values (right) by sex and split. Error bars represent standard deviations; ∗ and † depict statistical difference between women and men at p < 0.05 and p < 0.01, respectively. Speed (%) has been calculated as percentage difference of split speed and average race speed.

