Fig. 2.
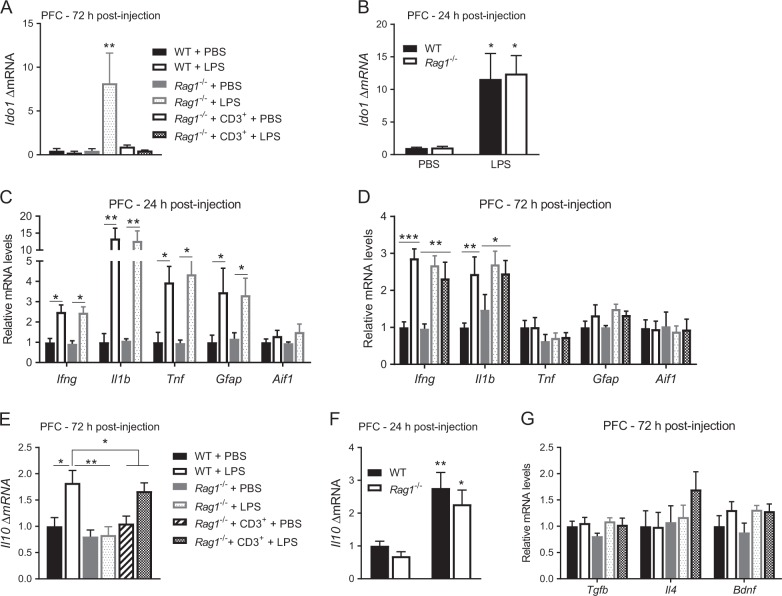
T lymphocytes regulate Il10 and Ido1 expression in the prefrontal cortex (PFC). a Ido1 mRNA level in the PFC 72 h after injection of lipopolysaccharide (LPS) (n = 6 mice per group). One-way ANOVA followed by Bonferroni’s multiple correction test (F(4,25) = 5.02, P = 0.004). b Ido1 mRNA level in the PFC 24 h after injection of LPS (n = 6–7 mice per group). Two-way ANOVA followed by Bonferroni’s multiple correction test (genotype x LPS interaction F(1,22) = 0.02, p = 0.89). mRNA levels of glial cell markers and proinflammatory cytokines in the PFC 24 h (c) and 72 h (d) post-LPS (n = 6–8 mice per group). e Il10 mRNA level in the PFC 72 h after injection in WT, Rag1−/− and reconstituted Rag1−/− mice (n = 8 mice/group). One-way ANOVA followed by Bonferroni’s multiple correction test (F(5,42) = 6.86, P = 0.0001). f Il10 mRNA level in the PFC 24 h after injection in WT and Rag1−/− mice (n = 7 mice/group). Two-way ANOVA followed by Bonferroni’s multiple correction test (genotype × LPS interaction F(1,21) = 0.06, p = 0.81). g Anti-inflammatory cytokine expression in the PFC 72 h post-LPS (n = 6–8 mice/group). Data are normalized to expression levels in the PBS group. The gene Aif1 encodes IBA1. The data are presented as mean ± standard error of the mean. ***P < 0.001, **P < 0.01, *P < 0.05

