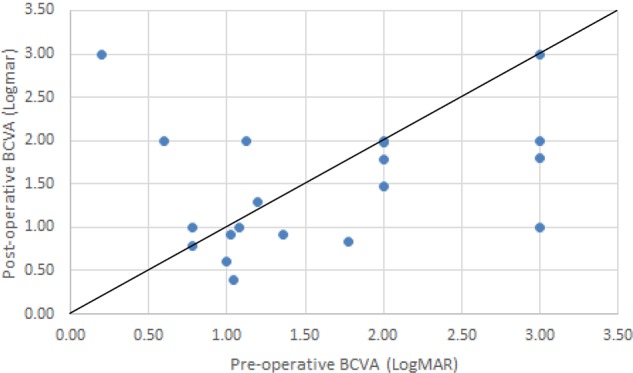
Fig. 1.

A plot of post-operative and pre-operative BCVA (logMAR) in cases of MHRD. The line of equality represents no change in BCVA with the points below the line indicating an improvement in BCVA and those above the line indicating a reduction in post-operative BCVA
