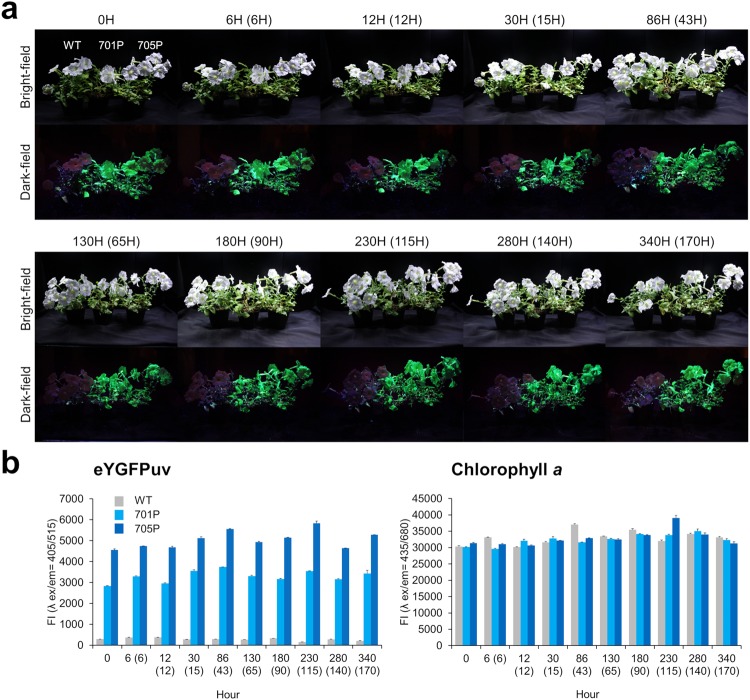
Figure 5.
Fluorescent levels of eYGFPuv and chlorophyll a during the long-term exposure of Petunia hybrida to UV-A light. (a) P. hybrida flowers (WT, 701P, and 705P) were set in the display case described in Supplementary Figure S4 and exposed to UV irradiation for approximately two weeks (actual UV exposure times are shown in parentheses). At each time point, whole plant images were taken under UV light excitation using the same image acquisition conditions (reported in Supplementary Table S2). The experiments were repeated twice with similar results, and one representative result is shown. (b) 4 mg mL−1 (50 μL) of crude protein extracts from harvested leaves were scanned in a M1000 Pro reader (TECAN, Männedorf, Switzerland) using the settings described in Supplementary Figure S3 and Supplementary Table S4. Fluorescence intensity (FI) at the peak excitation (ex) and emission (em) wavelengths of eYGFPuv (λ ex/em = 405/515 nm) and chlorophyll a (λ ex/em = 435/680 nm) are shown. The experiments were repeated twice with each data point measured in triplicates; a representative data set is shown as the mean value ± standard deviation.

