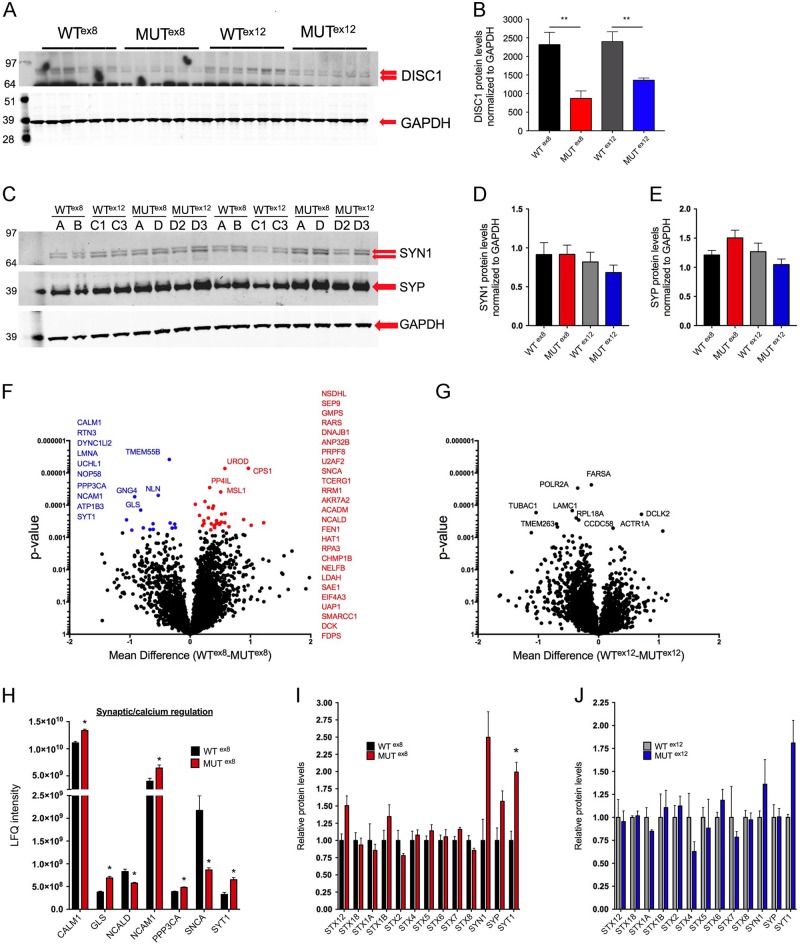
Fig. 2. DISC1 exon 8 and exon 12 mutations result in decreased DISC1 protein levels and altered levels of a subset of synaptic proteins.
Day 21 iN cultures were lysed and used for western blot or proteomics as shown. a Representative DISC1 western blot. b Quantification of DISC1 expression by western blot, normalized to GAPDH. n = 6 for WTex8, 6 for MUTex8, 6 for WTex12, 6 for MUTex12. c Representative SYN1 and SYP western blot. d, e Quantification of SYN1 and SYP expression by western blot, normalized to GAPDH. n = 10 for WTex8, 10 for MUTex8, 10 for WTex12, 10 for MUTex12. Statistics a–d: Two-tailed Student’s t-test, **p < 0.01. f–j Day 21 iN lysates were used for proteomics by LC–MS/MS, n = 4 for each genotype. f Volcano plot of proteomic data of WTex8 vs MUTex8, with significantly upregulated genes colored blue and significantly downregulated genes colored red. g Volcano plot of proteomic data of WTex12 vs MUTex12, with no genes achieving statistical significance. h Differential expression of select proteins involved in neural adhesion, calcium signaling, and the synapse in MUTex8 vs WTex8 lysates. i, j Expression of presynaptic proteins by proteomics in WTex8/MUTex8i and WTex12/MUTex12j. Statistics f–j: Paired t-test with two-stage linear step-up procedure of Benjamini, Krieger, and Yejutieli, with false discovery rate Q = 5%. See also Supp. Table 2

