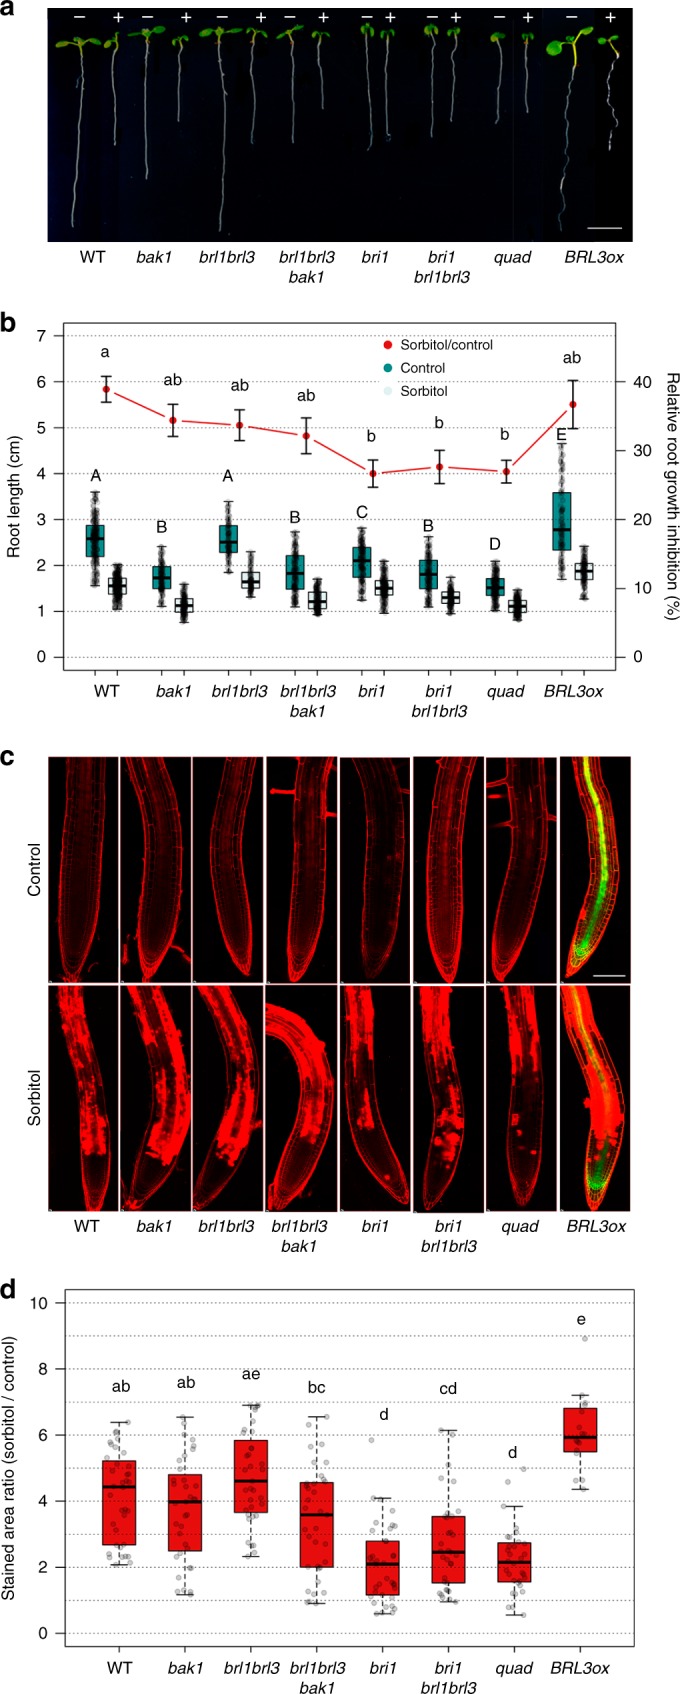
Fig. 1.

BR perception mutant roots are less sensitive to osmotic stress. a Seven-day-old roots of WT, BR mutants bak1, brl1brl3, brl1brl3bak1, bri1, bri1brl1brl3, and bri1brl1brl3bak1 (quad), and BR overexpressor line 35S:BRL3-GFP (BRL3ox) grown in control (−) or 270 mM sorbitol (+) conditions. Scale bar: 0.5 cm. b Boxplots depict the distribution of 7-day-old root lengths in control (dark green) or sorbitol (light green) conditions. Red line depicts relative root growth inhibition upon stress (ratio sorbitol/control ± s.e.m.). Data from five independent biological replicates (n > 150). Different letters represent significant differences (p-value < 0.05) in an ANOVA plus Tukey’s HSD test. c Four-day-old roots stained with propidium iodide (PI, red) after 24 h in control (top) or sorbitol (bottom) media. Green channel (GFP) shows the localization of the BRL3 membrane protein receptor in the vascular tissues in primary roots. Scale bar: 100 μm. d Quantification of cell death in sorbitol-treated root tips. Boxplots show the relative PI staining (sorbitol/control) for each genotype. Averages from five independent biological replicates (n > 31). Different letters represent significant differences (p-value < 0.05) in an ANOVA plus Tukey’s HSD test. Boxplots represent the median and interquartile range (IQR). Whiskers depict Q1 – 1.5*IQR and Q3 + 1.5*IQR and points experimental observation
