
FIGURE 1.
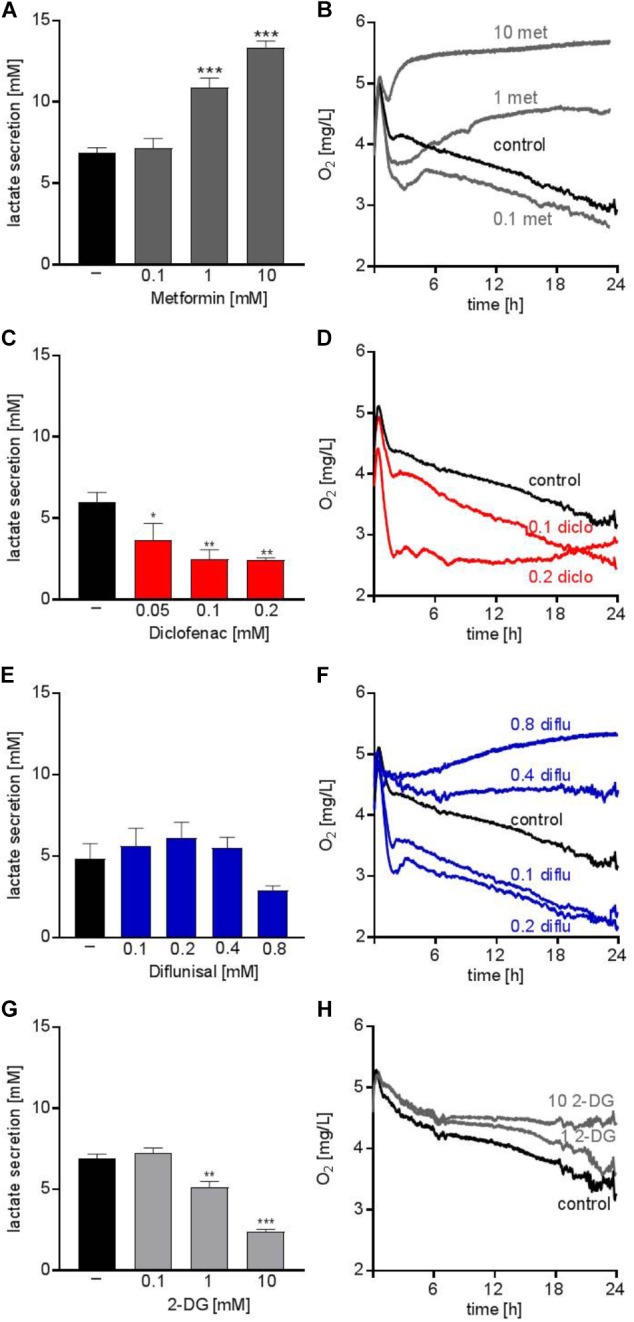
Metabolic effects of single treatment with metformin, diclofenac, diflunisal and 2-DG on THP-1 cells. (A,C,E,G) Cells were seeded in 24-well plates at a concentration of 5 × 10⁵ cells/ mL medium with or without metformin, diclofenac, diflunisal and 2-DG in the indicated concentrations. After 24 h, cumulative lactate levels in cell culture supernatants were determined. (B,D,F,H) Cells were seeded in the same density in 24-well dishes with integrated optical oxygen (OxoDish®) sensors in the bottom of each well. The SensorDish® Reader was placed in the incubator for 24 h and measurements were performed in 30–60 s intervals. (A,C,E,G) data are shown as mean ± SEM (n ≥ 3), ∗P < 0.05, ∗∗P < 0.01, and ∗∗∗P < 0.001 significance was calculated by ANOVA and post hoc Holm-Sidak’s multiple comparisons test. (B,D,F,H) data are shown as mean (n ≥ 3 with the exception of (F) 0.4–0.8 mM diflunisal n = 2).