
FIGURE 5.
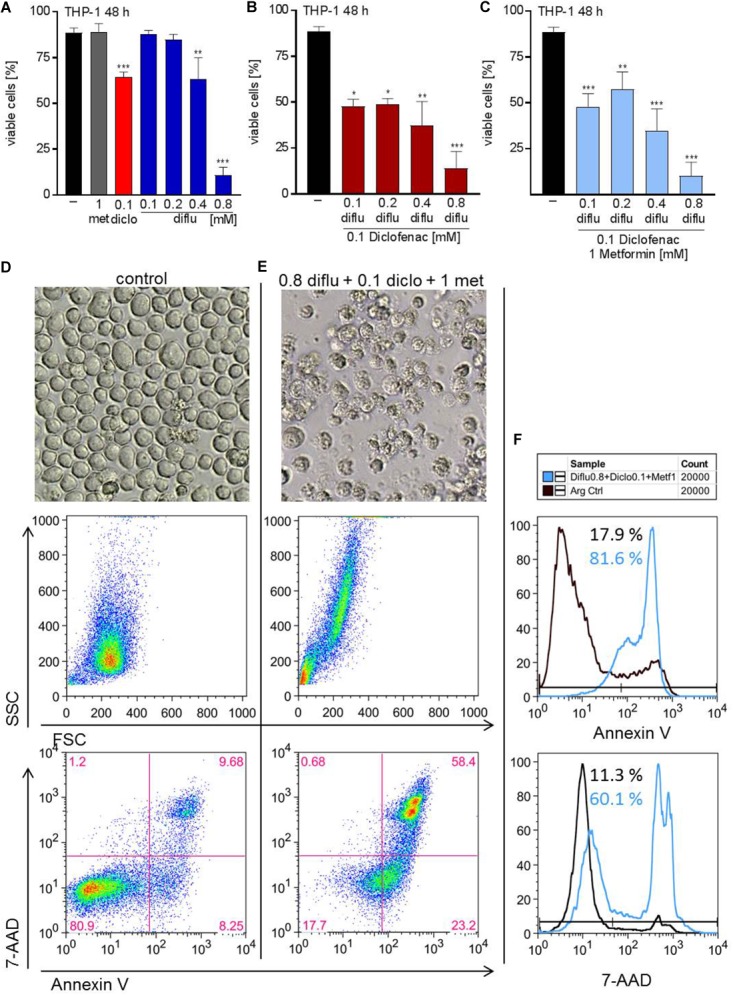
Impact of metformin, diclofenac and diflunisal on apoptosis in THP-1 cells. For analysis of apoptosis, 3–5 × 10⁵ cells/mL medium were treated with (A) single drugs or (B) combination of increasing concentrations of diflunisal (0.1–0.8 mM) plus 0.1 mM diclofenac or (C,E) triple combinations for 48 h. After treatment, pictures were taken to document the morphology of (D) untreated or (E) treated cells; one representative experiment is shown. Cells were stained for Annexin-V-FITC and 7-aminoactinomycin D (7-AAD) and analyzed by flow cytometry. Percentage of Annexin-V single positive cells (lower right quadrant), regarded as early apoptotic cells, 7-AAD single positive cells (upper left quadrant), regarded as necrotic cells or Annexin V/7-AAD double positive cells (upper right quadrant), representing late apoptotic cells, can be depicted either from scatter blots or histograms (D,E) Representative scatter blots and (F) histograms are presented. (A–C) data are shown as mean ± SEM (n = 3), ∗P < 0.05, ∗∗P < 0.01, and ∗∗∗P < 0.001; significance was calculated by ANOVA and post hoc Holm-Sidak’s multiple comparisons test.