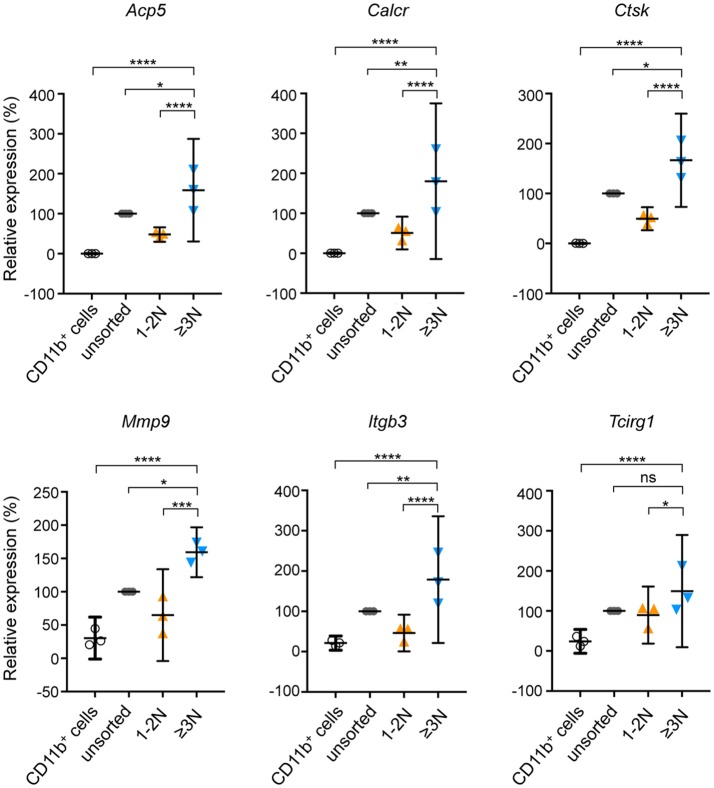
Figure 3.
mRNA expression of OCL-specific genes on sorted and unsorted populations. Relative gene expression of Acp5, Calcr, Ctsk, Mmp9, Itgb3 and Tcirg1 was determined by RT-qPCR on murine CD11b+ OCL precursors (black), unsorted cells (gray), sorted cells with 1-2 nuclei (1–2N, orange) and sorted cells with 3 and more nuclei (≥3N, blue). Unsorted cells were defined as 100% of relative expression and compared to sorted cells. Differences were calculated with the 2−ΔCt method after normalization to the 36B4 RNA. Results are represented as the mean with 95% confidence interval of three independent cell preparations and sortings, each from 1 mouse, and experiments were conducted in triplicates. Acp5, tartrate-resistant acid phosphatase; Calcr, calcitonin receptor; Ctsk, cathepsin K; Mmp9, matrix metallopeptidase 9; Itgb3, integrin beta 3 of the vitronectin receptor; Tcirg1, V-ATPase subunit a3. ns, not significant; *p < 0.05; **p < 0.01; ***p < 0.001; ****p < 0.0001.

