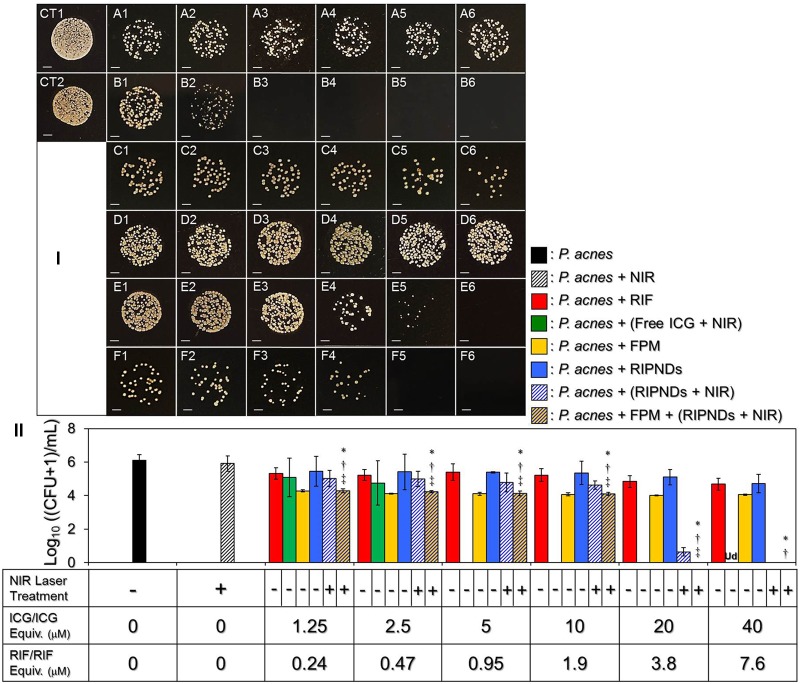
FIGURE 8.
The antimicrobial efficacy of the RIPDNDs to P. acnes. (I) Photographic images of P. acnes colonies after treated with various conditions. Rows (A – F) represent the groups that cells were treated with free RIF (row A), free ICG + NIR (row B), FPM (row C), RIPNDs (row D), RIPNDs + NIR (row E), and FPM + RIPNDs + NIR (row F), respectively. The columns 1–5 denote that the bacteria were treated with free RIF in 0.24, 0.47, 0.95, 1.9, 3.8, or 7.6 μM (row A), respectively, free ICG in 1.25, 2.5, 5, 10, 20, or 40 μM (row B), respectively, FPM stimulated by RIPNDs with combined RIF/ICG in 0.24/1.25, 0.47/2.5, 0.95/5, 1.9/10, 3.8/20, or 7.6/40 μM (rows C), respectively, or RIPNDs with aforementioned dose settings (rows D–F). CT1 denotes that the bacteria were treated with neither compound (ICG and/or RIF) nor NIR exposure. CT2 represents that the bacteria were treated with NIR alone for 5 min followed by incubation at 37°C for 24 h. Each image represents the colony forming condition of each group using 1000-fold diluted P. acnes as the initial bacteria seed after cultivation in the agar plate for 3 days. All images were photographed using an optical microscope at 200X magnification. Scale bar = 2 mm. (II) Quantitative analyses of the colony number of P. acnes after treatment with free RIF, ICG, FPM, and/or RIPNDs in different conditions as indicated in the X-axis. Values are mean ± s.d. (n = 3). ∗P < 0.05 compared to the group with equal concentration of free RIF. †P < 0.05 compared to the group with equal dose of RIPNDs without NIR exposure. ‡P < 0.05 compared to the group with equal dose of RIPNDs and NIR irradiation.

