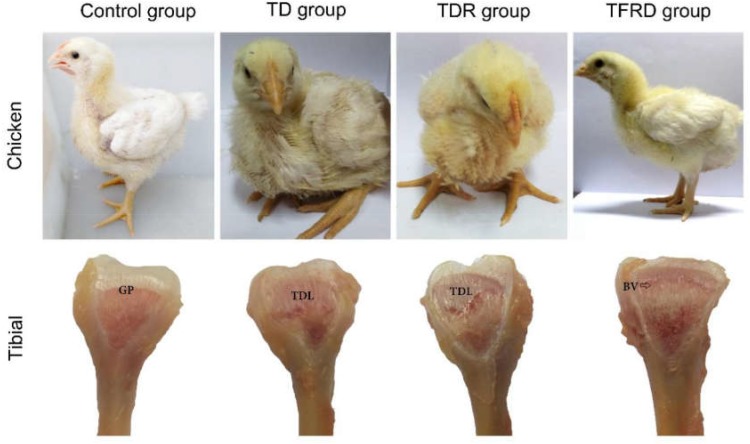
FIGURE 4.
Clinical manifestations and morphological of growth plates in each group. Compared with TD group, the clinical manifestations of control group, and TFRD group were obviously better. Tibial dyschondroplasias of TD and TDR groups show different degrees of damage. The difference was significant between TDR and TFRD groups. BV, blood vessel; GP, growth plate; TDL, tibial dyschondroplasias lesion.

