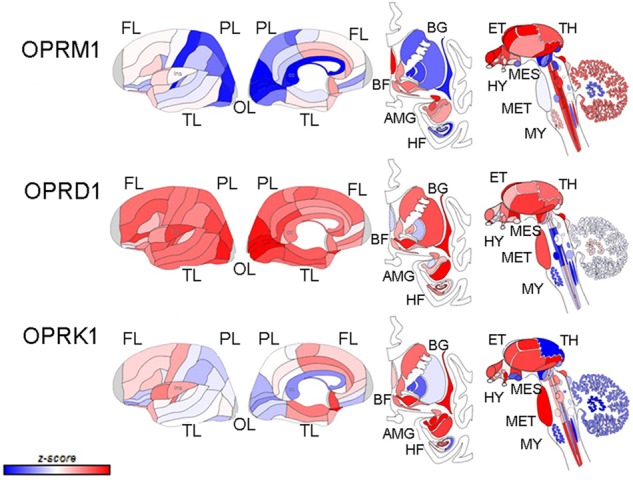
Fig. 1.

Schematic depicting the differential localization of MOR, DOR, and KOR based on gene expression patterns in human brain (donor H0351,1016, 55 years., Male White or Caucasian from the Allen Brain Atlas http://www.brain-map.org). The first two columns show outer and inner surfaces of the left hemisphere. Subcortical structures are represented from the frontal view (third column), and subcortical and brainstem structures are shown in the side view (fourth column). The color bar displays expression values using z-score normalization. (Modified with permission from; [42] http://creativecommons.org/licenses/by/4.0/). The same image from [42] was recreated using the Allen Brain Atlas and labels were added
