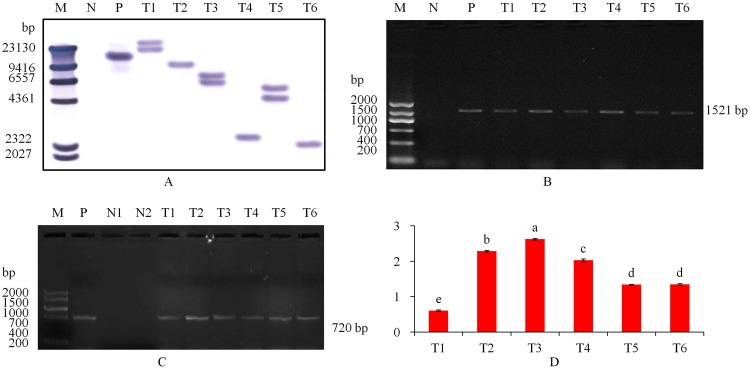
Figure 3.
Molecular detection. (A) Southern blot analysis of genomic DNA from PCR-positive transformed tobacco lines. The genomic DNA was digested with Hind III and hybridized with a AtHKT1 probe labeled with digoxigenin. (B) verification of transgenic plants by RT-PCR of AtHKT1 gene. (C) RT-PCR of GFP gene. (D) expression of AtHKT1 gene with qRT-PCR in transgenic (T1 to T6) tobacco plants. Tukey’s HSD test at P < 0.05 was used in analysis of significant differences among means of different transgenic potato plants. The standard errors are shown in line bars (n = 9, i.e., 3 plants × 3 replications). M, DIG DNA Marker II in A and DNA Marker V in B and C; N1, untransformed tomato plant as a negative control; N2, ddH2O as a negative control; P, plasmid AtHKT1-GFP as a positive control; T1 to T6, transgenic tobacco lines. The grouping of gels/blots cropped from same part of the same gel.

