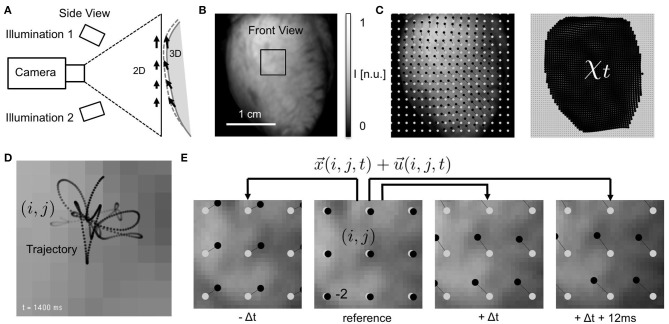
Figure 1.
Electromechanical optical mapping with beating, strongly deforming and fluorescing hearts. (A) Schematic drawing of experimental setup with single high-speed camera filming ventricular surface of rabbit heart (side view). Tracking of motion is possible only within the image plane (2D). (B) Raw video image (128 × 128 pixels) showing heart surface during optical mapping with voltage-sensitive staining (front view). ROI see (E). (C) Tracked displacements and mechanical configuration χt at time t (left: every 8th vector, right: every 2nd vector). Points (black) indicating displacements of single tissue segment with respect to reference position (gray). See also Supplementary Video 1. (D) Trajectory of tracked tissue segment moving during ventricular fibrillation through pixel plane. Motion amplitudes are in the order of a few pixels (maximal 3–4 pixels from initial position, 2 ms temporal resolution). (E) Tracking of tissue movements during pacing with displacement amplitudes in the order of pixels. Points (black) indicating movements of single tissue segment (i, j) with respect to reference position (gray) in reference video image Ir (shown is every 10th segment or vector for illustration purposes).

