Figure 10.
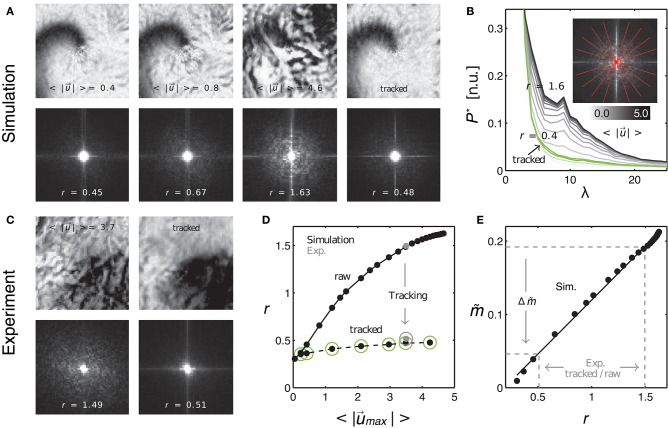
Evaluating tracking performance and residual motion artifacts by comparing synthetic to experimental data. (A) Synthetic optical maps before (panels 1–3) and after (panel 4) tracking. Increasing amplitudes of motion (panels 1–3: 0.4, 0.8, and 4.6 pixel) cause an increase in motion artifacts. Tracking and motion stabilization (panel 4) inhibits (residual) motion artifacts to levels found at 0.4–0.8 pixels of motion before tracking. Spectral maps obtained from the optical maps (bottom) show an increase in high-frequency spectral components with increasing motion. Tracking and motion compensation decreases the high-frequency spectral components to a level comparable to the left image (r = 0.45) with low amounts of motion (0.4 pixels). (B) Radial profiles of normalized spectral maps indicating an increase in width of the profiles (color-coded from gray to black, r = 0.4 to 1.6) with increasing motion and decrease in width after tracking (green curve). (C) Comparison with experimental data. Tracking and motion-stabilization reduces motion artifacts and radial profile width r (pre-tracking r = 1.49, post-tracking r = 0.51). (D) Profile width r over magnitude of motion for raw and tracked (circles) simulated (black dots) and experimental data (gray dots). (E) Linear increase of motion artifact strength with spectral profile width r. Motion artifact reduction calculated for experimental data via the linear relationship between motion artifact strength (obtained in simulations mimicking experimental data) and spatial high-frequency components in optical maps (quantifiable by r with both experimental and simulation data).

