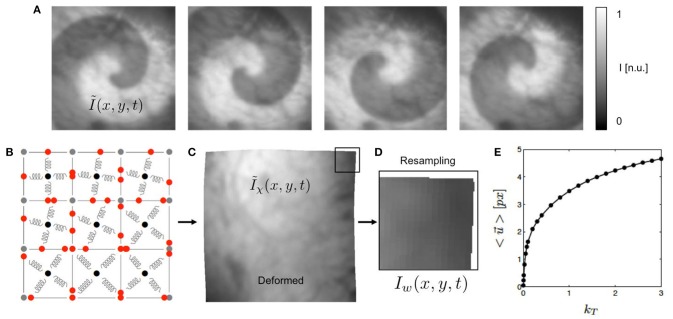
Figure 2.
Generation of synthetic optical maps using computer simulations. (A) Original optical mapping image (100 × 100 pixels) cropped from video still frame showing heart surface of rabbit heart superimposed by simulated spiral wave pattern (exaggerated) generated using reaction-diffusion excitable dynamics model. Simulated fluorescence intensity drop during depolarization of action potential (exaggerated). (B) Deformable elastic medium simulated with mass-spring damper lattice model (here consisting of only 3 × 3 cells for illustration purposes, system used in study consists of 100 × 100 cells). Each pixel in (A) corresponds to one cell. (C) Deformed video image Ĩχ(x, y) containing fluorescent signal (ΔF/F < 5%, not visible in a still frame), deformation caused by spiral dynamics. See also Supplementary Video 3. (D) Deformed and resampled part of video image I(x, y). (E) Overall displacements of simulation in pixels depending on simulation parameter kT to modulate contraction strength of springs.

