Figure 7.
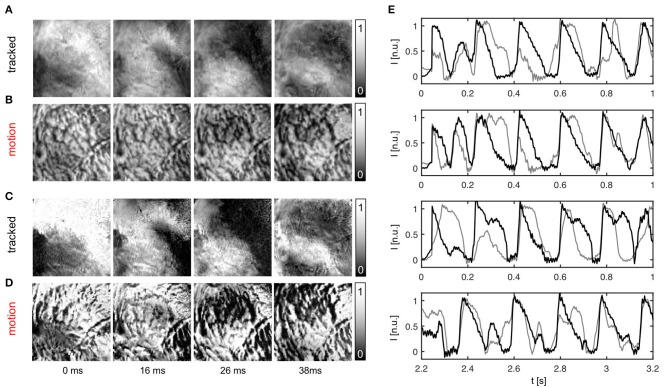
Action potential vortex waves mapped on contracting left ventricular surface of rabbit heart during ventricular fibrillation. Electromechanical optical mapping was performed with voltage-sensitive staining (Di-4-ANEPPS, 128 × 128 pixels, 500 fps, approx. 1 × 1 cm field of view). (A,C) Maps with substantially inhibited motion artifacts after tracking and motion-stabilization showing action potential waves. (B,D) Action potential wave maps without tracking and motion stabilization. Maps exhibit strong motion artifacts. In (A,B) and (C,D) the same activity is shown with two different normalizations, see main text. (E) Exemplary time-series obtained from optical maps with motion before (gray) and after tracking and numerical motion-stabilization (black).

