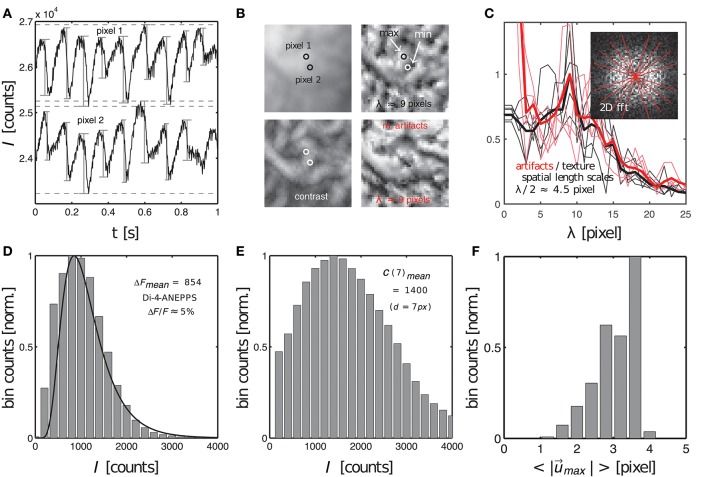
Figure 9.
Characterization of dissociation-related motion artifacts in optical mapping videos showing the contracting, fluorescing heart surface. Measurements of important quantifiers: fluorescent signal strength f, image contrast c, amplitude of motion and characteristic length scales λ of short-scale image gradients. (A) Action potentials measured during ventricular fibrillation in two close by pixels (see B) on the surface of a mildly contracting rabbit heart [graph reproduced from Christoph et al. (2017)]. Difference in baseline reflects different pixel intensities. (B) Raw optical mapping video image (top left), contrast image (bottom left), contrast image normalized to local minima and maxima (top right) and motion artifacts (bottom right). All images have the same characteristic texture with the same characteristic length scale or dominant spatial frequency (λ ≈ 9 pixels). (C) Radial profiles (fat lines: average) within 2D power spectra of spatial patterns (contrast image and motion artifacts) indicate dominant frequency of λ ≈ 9 pixels (see two overlapping peaks). (D) Fluorescent signal strength or fractional change in fluorescence ΔF (given as intensity counts I) measured from sequences of action potentials, see (A), with the peak of the distribution at ΔF = 854 intensity counts in 16-bit video image. (E) Image contrast (given as intensity counts I) with peak at C = 1400 in 16-bit video image. (F) Amplitudes of motion during ventricular fibrillation (2 − 4 pixels, 128 × 128 pixel sensor size).

