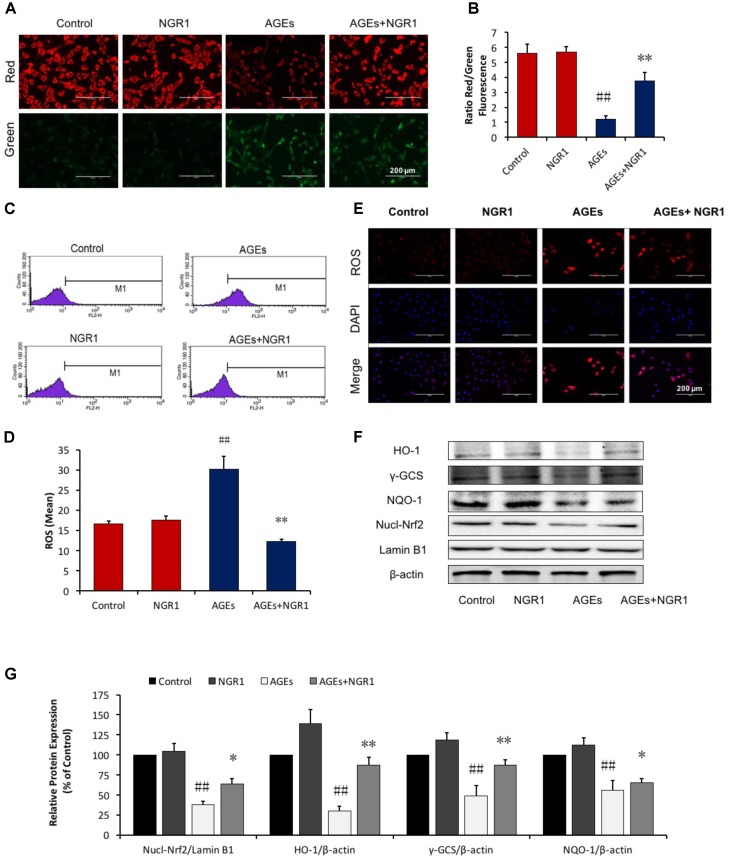
FIGURE 2.
NGR1 inhibits mitochondrial membrane depolarization and intracellular ROS in H9c2 cardiomyocytes induced by AGEs. (A,B) Representative images and bar graphs of JC-1 red/green cells and merges showed that NGR1 increased the ratio of red to green fluorescence intensity. (C) Intracellular ROS levels and statistical analysis. (D) in H9c2 cardiomyocytes evaluated using a flow cytometer, M1 represents ROS positive cell proportion. (E) Representative images of MitoSOX red staining. The bar represents 200 μm. (F) Immunoblotting analysis of Nrf2-mediated anti-oxidative enzymes in H9c2 cells. (G) The relative protein expression of Nucl-Nrf2, HO-1, γ-GCS, and NQO-1 compared to β-actin are expressed in the bar graphs. The quantitative data are presented as the mean ± SD of three independent experiments. ##P < 0.01 vs. the Control group, ∗P < 0.05 or ∗∗P < 0.01 vs. the AGEs group.

