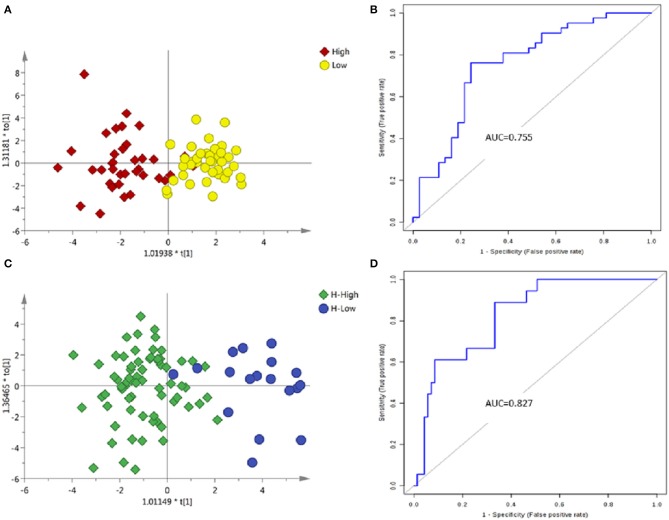
Figure 4.
Analysis of metabolic profiling in low- and high-grade NMIBC. (A) Score plot of OPLS-DA model based on metabolome between low- and high-grade NMIBC without hematuria. (B) ROC plot based on model to quantify the discrimination degree of NMIBC grading without hematuria. (C) Score plot of OPLS-DA model based on metabolome between low- and high-grade NMIBC with hematuria. (D) ROC plot based on model to quantify the discrimination degree of NMIBC grading with hematuria.

