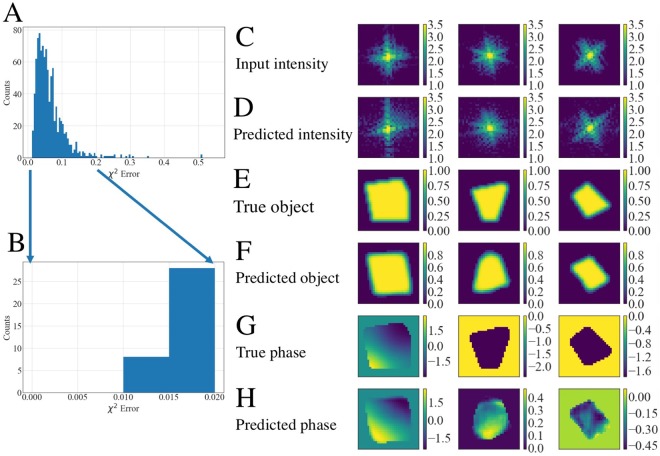
Figure 4.
Best predictions of CDI NN. (A) Histogram of the error computed for the test samples. (B) Close-up view of the predictions with the lowest χ2 error. (C) Input diffraction patterns, (D) predicted intensities computed by taking an FT of the complex object obtained from the predicted shape and phase. (E,F) Corresponding actual shape and predicted shape. (G,H) Corresponding actual phase and predicted phase. CDI NN fares well when faced with large objects with weak phase. Intensity units are dimensionless while phase is in radians.

