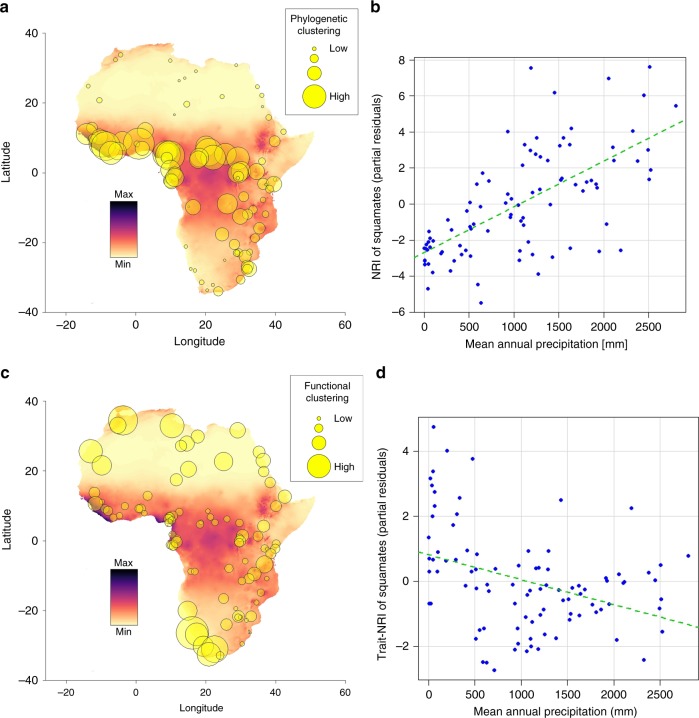
Fig. 4.
Spatial distribution of phylogenetic and functional structure. a, c Spatial distribution of phylogenetic and functional structure of African squamates, showing correlations with mean annual precipitation (most important variable according to AICc weights). The colour gradient represents a gradient of mean annual precipitation from high (dark) to low (light). b, d Partial residual plots of phylogenetic and functional structure and mean annual precipitation of the best respective ordinary least squares models

