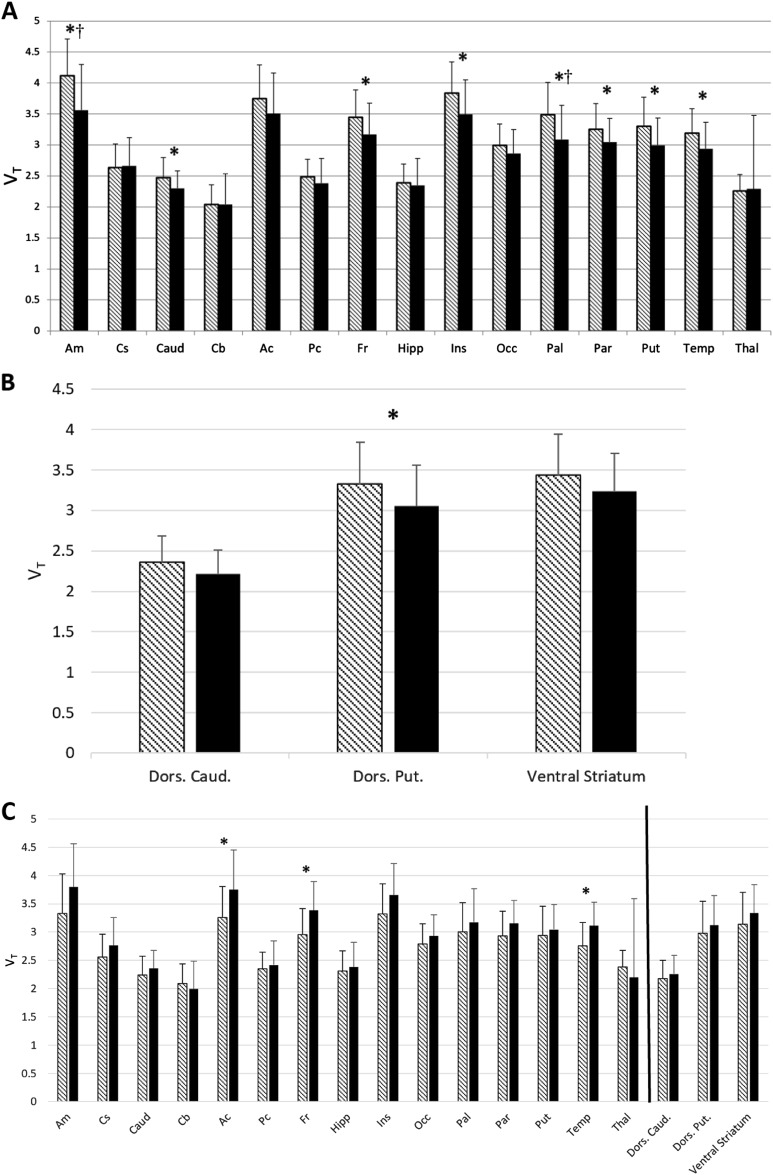
Fig. 2.
a–c ROI Analysis of VT. a [11C] LY2795050 VT in the whole cohort (n = 64) by region and drinking status. Multivariate analysis showed a significant main effect for drinking status, i.e., the AD cohort (n = 36, solid bars) had lower VT than the HC cohort (n = 28, hatched bars). Bars represent the mean ± SD of [11C]LY2795050 VT respectively for amygdala (Am), centrum semiovale (Cs), caudate (Caud), cerebellum (Cb), anterior cingulate cortex (Ac), posterior cingulate cortex (Pc), frontal cortex (Fr), hippocampus (Hipp), insula (Ins), occipital cortex (Occ), ventral pallidum (Pal), parietal cortex (Par), putamen (Put), temporal cortex (Temp), thalamus (Thal). Regions are non-overlapping. *indicates the significant difference between the regional VT of AD versus HC, p < 0.05 uncorrected for multiple comparisons. † indicates significance after multiple comparison correction. b [11C] LY2795050 VT in the whole cohort (n = 64) of alcohol-dependent (AD) (n = 36) versus healthy control (HC) subjects (n = 28) at the region of interest (ROI) level. Hatched bars represent the HC cohort and solid bars represent the AD cohort. Bars represent the mean ± SD of [11C]LY2795050 VT respectively for dorsal caudate (Dors. Caud.), dorsal putamen (Dors. Put), and ventral striatum. *indicates the significant difference between the regional VT of AD versus HC, p < 0.05 uncorrected for multiple comparisons. c [11C] LY2795050 VT in the cohort (n = 36) of AD non-smokers (n = 18) versus AD smokers (n = 18) at the region of interest (ROI) level. Hatched bars represent the non-smokers and solid bars represent the smokers. Bars represent the mean ± SD of [11C]LY2795050 VT respectively for regions listed in Fig. 2a, b above. The black line separates the striatal sub-regions from the main ROIs. *indicates the significant difference between the regional VT of smokers versus non-smokers, p < 0.05 uncorrected for multiple comparisons

