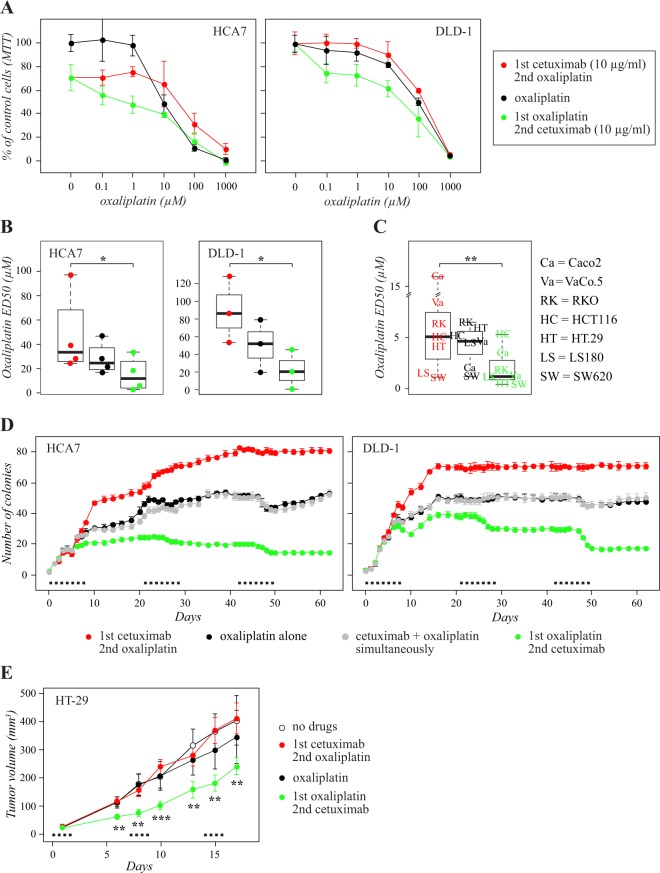
Figure 1.
Sequence of administration determines the effect of the regimen including cetuximab and oxaliplatin. Sequential administration of cetuximab before or after oxaliplatin was compared to administration of oxaliplatin alone using MTT (A–C), soft agar (D), and mouse xenograft (E) growth assays. (A–C) Cells were (1) treated for 24 hours (for day 3 of the experiment) with the indicated concentrations of oxaliplatin alone (black curves), (2) treated first for 48 hours (days 1 and 2) with 10 μg/ml cetuximab followed by 24 hour (day 3) treatment with the indicated concentrations of oxaliplatin (red curves), or (3) treated first for 24 hours (day 3) with oxaliplatin followed by 48 hour (days 4 and 5) treatment with 10 μg/ml cetuximab (green curves). MTT analysis was carried out after day 5 of the experiment. (A) Representative MTT experiments of HCA7 (left panel) and DLD-1 (right panel) cells. Mean +/− SD is shown. (B) Oxaliplatin ED50 values of sequential treatments from 3–4 independent experiments with HCA7 and DLD-1 cells. (C) Oxaliplatin ED50 values of sequential treatments from single independent experiments with the seven indicated cell lines. The box plots indicate the median, the second and third quartiles, and the range of the data. *P < 0.05; **P < 0.01. (D) HCA7 (left panel) and DLD-1 (right panel) cells suspended in soft agar were (1) treated for 48 hours (for days 4 to 5 of each treatment cycle) with oxaliplatin alone (black curves), or (2) in simultaneous combination with cetuximab (grey curves), (3) treated first for 72 hours (days 1 to 3) with cetuximab followed by 48 hour (days 4 to 5) treatment with oxaliplatin (red curves), or (4) treated first for 48 hours (days 4 to 5) with oxaliplatin followed by 72 hour (days 6 to 8) treatment with cetuximab (green curves). The cycle was repeated three times every 21 days as indicated by black dots. The concentrations used for oxaliplatin and cetuximab were 50 µM and 10 µg/ml, respectively. Mean +/− SD is shown. (E) Nude mice carrying HT-29 cell xenografts were treated with i.p. injections of (1) vehicle alone on day 1 of each treatment cycle (white dots), (2) oxaliplatin alone on day 1 (black dots), (3) cetuximab on day 1 followed by oxaliplatin on day 2 (red dots), or (4) oxaliplatin on day 1 followed by cetuximab on day 2 (green dots). The cycle was repeated three times every seven days as indicated by black dots. The concentrations used for oxaliplatin and cetuximab were 10 mg/kg and 40 mg/kg, respectively. Mean +/− SEM is shown. **P < 0.01; ***P < 0.001, for a comparison between the two alternative sequences (green vs. red curves).

