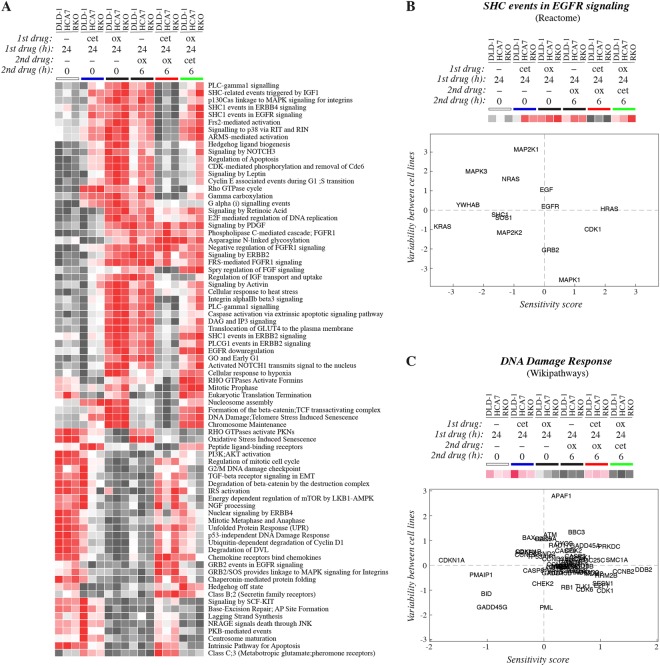
Figure 3.
RNAseq analysis of transcriptomic profiles induced by sequential treatments. DLD-1, HCA7, and RKO cells were subjected to different regimens containing 10 μg/ml cetuximab and/or 50 μM oxaliplatin: (1) control medium for 24 hours (white bar), (2) cetuximab for 24 hours (blue bar), (3) oxaliplatin for 24 hours (left black bar), (4) control medium for 24 hours followed by oxaliplatin for 6 hours (right black bar), (5) cetuximab for 24 hours followed by oxaliplatin for 6 hours (red bar), or (6) oxaliplatin for 24 hours followed by cetuximab for 6 hours (green bar). Gene expression was analyzed using RNAseq. (A) Data were sectioned into pathway matrices according to the annotations of the Reactome database and converted into a heatmap. (B,C) Sensitivity scores reflecting changes in the expression of single genes in response to the different treatment protocols were plotted against the variation in the expression between the three different cell lines. Data are shown for sets of genes constituting two pathways, one reflecting differential responses to EGFR manipulation (“SHC events in EGFR signaling”) (B), and the other differential responses to the DNA damage induction by oxaliplatin (“DNA Damage Response”) (C). The two pathways were based on annotations by the Reactome (B) and Wikipathways (C) databases also shown as heatmaps in panel A and Suppl. Fig. 5, respectively.

