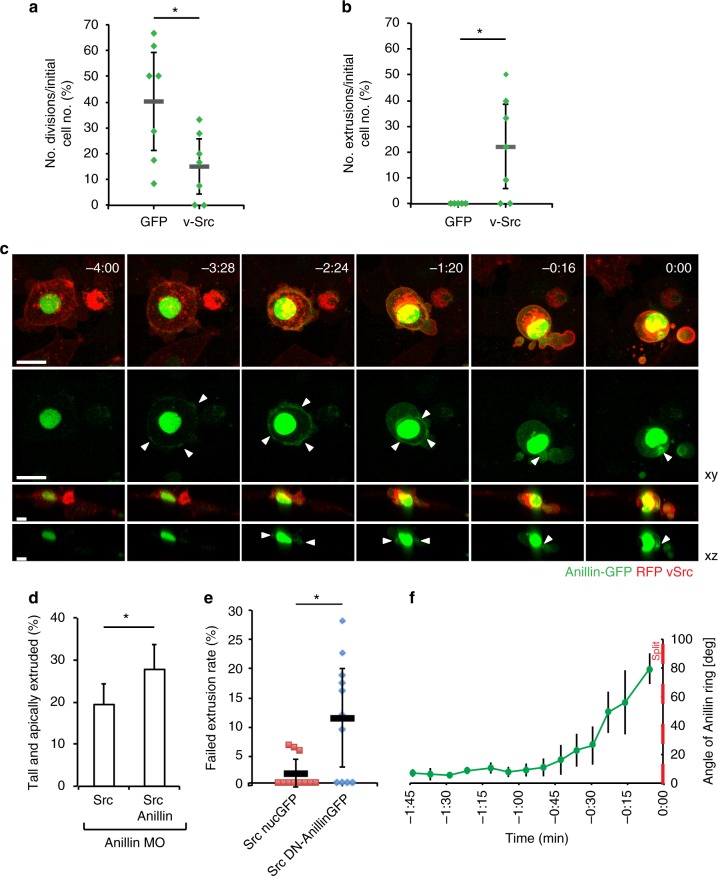
Fig. 2.
Contractile Anillin ring is recruited to the lateral cortex prior to extrusion. a, b Quantification of EGFP and EGFP-vSrc cell division (a) and extrusion (b) rates based on time-lapse imaging. Division rates were calculated as the number of divisions over 4 h divided by the initial number of GFP-positive cells per embryo. Each mark represents a division rate in a single embryo. Grey lines represent mean values ± standard deviation (s.d.). Seven embryos were imaged per condition in 14 independent experiments (total number of cells: nGFP = 121, nSrc = 73). *P < 0.05 (Student’s t-test). c Time-lapse imaging of Anillin-GFP during vSrc cell extrusion. Embryos were injected with the dUAS:myr-Cherry-vSrc;Anillin-GFP construct. Movies were taken over 4 h. Frames were extracted from a representative movie at indicated times where t = 0 is the moment of extrusion. White arrowheads indicate the position of the Anillin ring. Scale bars, 25 µm (xy) 10 µm (xz). d The effect of exogenous Anillin on rescuing the Anillin morphant phenotype cell-autonomously in vSrc-driven extrusion. Embryos were injected with the following constructs: dUAS:EGFP-vSrc and dUAS:EGFP-vSrc,Anillin-GFP and the Anillin morpholino. Data are mean ± s.d. of three independent experiments (total number of embryos: nSrc = 33; nSrc,Anillin = 32). *P < 0.01 (Student’s t-test). e Quantification of the failed extrusion rate based on time-lapse imaging. Embryos were injected with the following constructs: dUAS:EGFP-vSrc;nucGFP and dUAS:EGFP-vSrc;DN-Anillin. Failed extrusion rates were calculated as the number of cells that rounded up and then returned to the monolayer without division or extrusion over 4 h by the initial number of GFP-positive cells per embryo. Each mark represents a division rate in a single embryo. Eleven embryos were imaged per condition in three independent experiments (total number of cells: nSrc = 168, nSrc,DNAnillin = 149). Grey lines represent mean values ± s.d. *P < 0.05 (Student’s t-test). f Quantification of the angle between the Anillin ring and the surface of the embryo over time. Data from four cells acquired in three independent experiments were then aligned to the time of extrusion, t = 0, averaged ± s.d. and plotted

