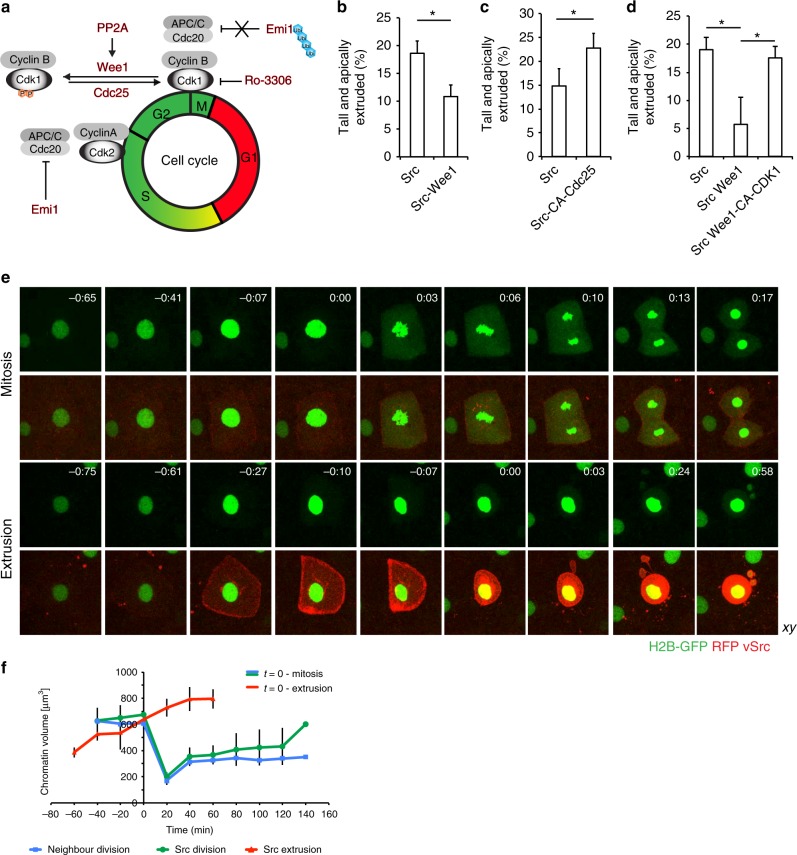
Fig. 3.
vSrc-transformed cells extrude in early mitosis. a A schematic model of cell cycle regulation. Highlighted in red are the molecules whose roles in cell extrusion were tested in this work. b The effect of Wee1 expression on vSrc-driven extrusion. Embryos were injected with the following constructs: dUAS:EGFP-vSrc and dUAS:EGFP-vSrc;Wee1. Data represent the number of tall and extruded cells divided by the total number of GFP-positive cells. Data are mean ± s.d. of three independent experiments (total number of embryos: nSrc = 21; nSrc,Wee1 = 27). *P < 0.05 (Student’s t-test). c The effect of constitutively active Cdc25 on vSrc-driven extrusion. Embryos were injected with the following constructs: dUAS:EGFP-vSrc and dUAS:EGFP-vSrc;CA-Cdc25. Data are mean ± s.d. of three independent experiments (total number of embryos: nSrc = 18; nSrc,Cdc25 = 21). *P < 0.05 (Student’s t-test). d Constitutively active Cdk1 rescues Wee1 inhibition of vSrc-driven extrusion. Embryos were coinjected with the following constructs: dUAS:EGFP-vSrc alongside either dKrt18:myr-Cherry, dKrt18:Cherry-Wee1 or dKrt18:Cherry-Wee1;CA-Cdk1. Data are mean ± s.d. of three independent experiments (total number of embryos: nSrc = 30; n = 29; nSrc,Wee1,Cdk1 = 33). *P < 0.05 (Student’s t-test). e Time-lapse imaging of H2B-GFP in mitosis (top panel) and extrusion (bottom panel). Embryos were injected with the dUAS:myr-Cherry-vSrc;H2B-GFP construct. Movies were taken over 4 h and frames were extracted from a representative movie. t = 0 indicates either the beginning of mitosis (chromatin condensation) or the moment of extrusion. Scale bars, 10 µm. f Quantification of the chromatin volume (defined as the volume that H2B-GFP signal occupies in space) measured using the surface function of Imaris. The blue line follows chromatin volume change over time in a dividing EVL cell expressing myr-Cherry (averaged data from 3 cells), the green line—in a dividing vSrc cell (averaged data from 4 cells), the red line—in a extruding vSrc cell (averaged data from five cells). Error bars represent s.d.

