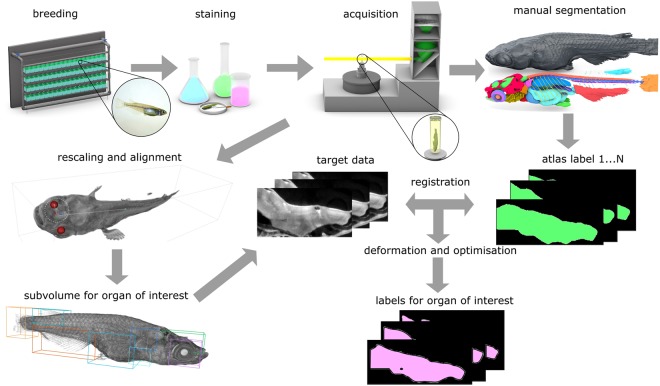
Figure 1.
Pipeline for quantitative 3D morphometric analysis After breeding and fish husbandry, the specimens are fixed and stained with contrast agent. 3D data sets are acquired with X-ray micro-CT at the synchrotron radiation facility. Manual segmentation leads to a reference atlas. Each new dataset is rescaled and aligned with respect to the reference model. For each organ of interest the subvolume is extracted. The atlas labels for the organ of interest are then registered and deformed to create new automatically segmented labels.

