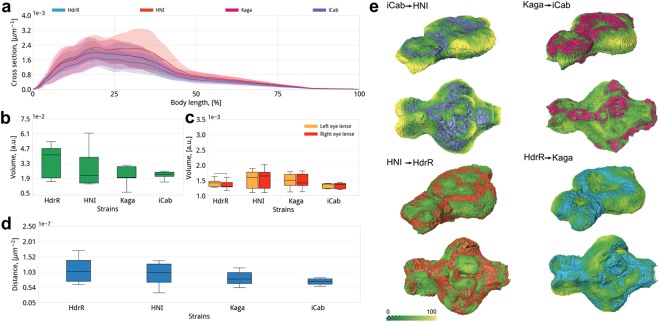
Figure 5.
Comparative morphometric analysis (a) Comparison of cross sectional areas along the antero-posterior axis (position indicated as percent of the total length); the head region comprises the anterior 30% of the total length. Solid lines are the average area of the cross section per strain, the semi-transparent region shows the standard deviation. All parameters are normalized to the total volume of specimens. Cross sections of iCab head region are smaller than those of HNI, HdrR and Kaga. (b–e) Comparative analysis of quantitative morphological parameters between the four isogenic inbred strains. Number of specimen is 7, 8, 5 and 6 for HdrR, Kaga, iCab and HNI respectively. (b) Comparison of brain volume, which is smaller in Kaga and iCab than in HdrR. (c) Comparison of lens volumes, showing that iCab and HdrR lenses are smaller than those of HNI and Kaga (d) Comparison of the distance between the eyes, which is bigger in HdrR compared to iCab and Kaga (e) Comparison of 3D strain specific brain shape morphometrics, shown in violet, magenta, orange and cyan for iCab, Kaga, HNI and HdrR strains respectively; antero-lateral and ventral view of brains. The strain specific shape is overlaid with the displacement distances (color-coded: green → yellow) to indicate variation in micrometers for each strain to be transformed into another one (for example, iCab → HNI). Note that different transformation patterns emerge from the pairwise comparisons.

