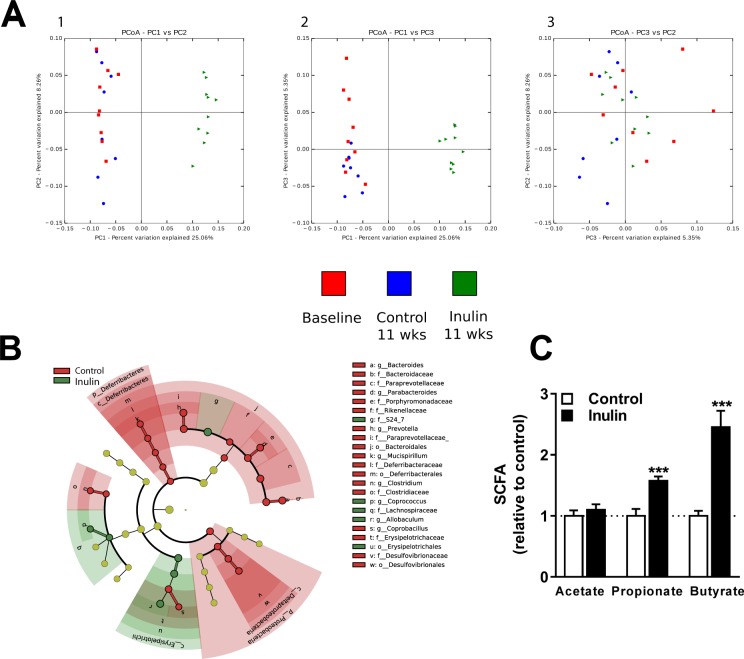
Figure 1.
Inulin modified gut microbiota composition and function. The effect of inulin supplementation on microbiota composition and function in mice fed a WTD containing 0.5% cholesterol ± inulin. (A) Principal coordinates analysis (PCoA) plot of unweighted UniFrac distances metric of 16S rRNA gene sequences at baseline (depicted in red) and for the subsequent control group (depicted in blue) and inulin group (depicted in green) after 11 weeks (wks) of treatment. To evaluate similarities between bacterial communities, graphs 1, 2, and 3 were generated using OTU’s based on the unweighted UniFrac distance metrics PC1 and PC2, PC1 and PC3, and PC3 and PC2, respectively, and are shown on multiple two-dimensional arrays. (B) The cladogram reports the taxa (highlighted by small circles and by shading) showing relative abundance values with a maximum depth to genus level (according to LEfSe). Red or green circles/shading represents taxa that are significantly higher in relative abundance, while yellow indicates taxa which did not differ in relative abundance between the two groups. The taxonomic level is indicated by letter preceding the underscore: o, order; f, family; g, genus. The central point in the cladogram represents the taxonomic domain ‘bacteria’ and each ring outward represents the next lower taxonomic level (phylum to genus). The darker the shading of the red or green colours, the higher the abundance (n = 8–10 mice per group). (C) Finally, the cecal SCFAs acetate, propionate, and butyrate were determined (n = 10 mice per group). Values are presented as means ± SEM. *P < 0.05, **P < 0.01, ***P < 0.001 vs. control.

