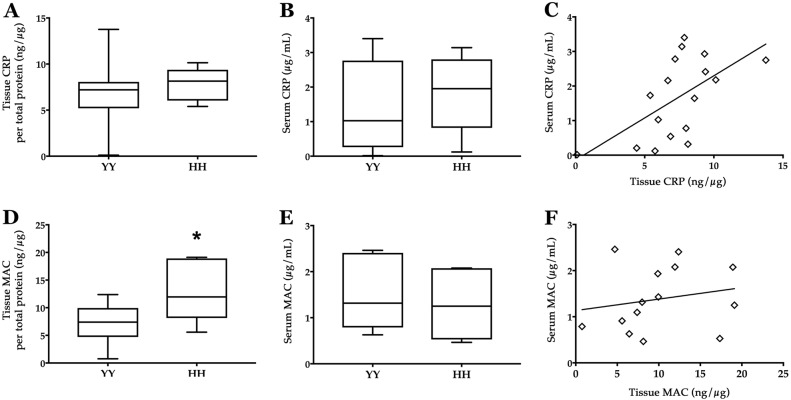
Fig. 1.
CRP (a–c) and sC5b-9/MAC (d–f) levels in the RPE/choroid and serum of genotyped human donors. Box-and-whisker plots, showing median, interquartile range, and minimum and maximum values, for RPE/choroid tissue (a, d) and serum (b, e) for low-risk (YY) and high-risk (HH) CFH donors. Direct comparisons between serum and tissue protein levels reveal a regression line with a significantly non-zero slope for CRP (R2 = 0.3543; c) but not for MAC (R2 = 0.0377; f). *p < 0.05

