Fig. 1.
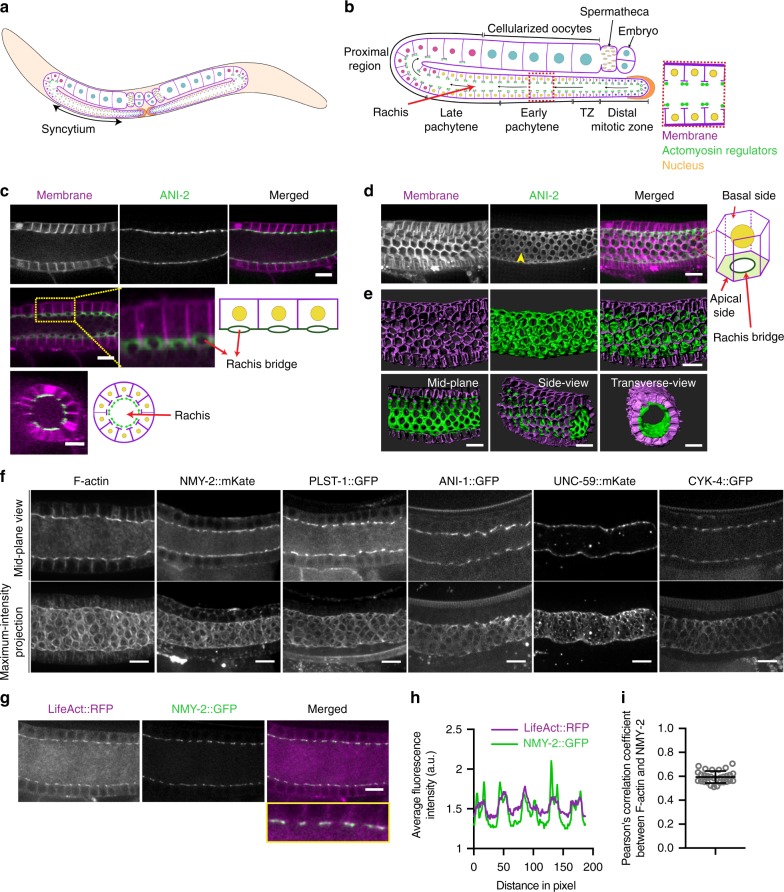
Actomyosin regulators form an inner corset enclosing the rachis of the C. elegans germline. a Schematic overview of the entire C. elegans hermaphrodite reproductive system. b Detailed schematic of a mid-plane view of a single arm of the C. elegans gonad. The germ cells enter mitosis at the distal end and progress through different stages of meiotic development to form mature oocytes at the proximal end. These germ cells are present in a syncytium, with openings into a central rachis. The T-region of germ cell membranes (magenta) in enriched in actomyosin regulators (green). Blue—mitotic nucleus, crescent shaped nucleus—transition zone nucleus, yellow—early meiotic nuclei, pink—diplotene stage nuclei, and cyan—diakinetic nuclei. c Top panel shows confocal images of a mid-plane view of the early meiotic region (transition and early pachytene) of the germline expressing mCherry::PH (magenta) and GFP::ANI-2 (green). Middle panel—projection of three consecutive slices showing the opening of germ cells into the rachis. Inset—magnified view and corresponding schematic explanation. Bottom panel—orthogonal view of the gonad and a schematic presentation. d Maximum-intensity projection of the early meiotic region of the germline expressing mCherry::PH (magenta) and GFP::ANI-2 (green). The germ cells have a hexagonal base and circular opening at the apical end. GFP::ANI-2 enriched outside the holes (yellow arrow heads) forming a tubular structure around the rachis. e Imaris reconstruction of the gonad showing three-dimensional views from different angles. f Mid-plane and maximum-intensity projected views of the distal region of the gonads expressing different actomyosin regulators. g Confocal image of the germline co-expressing LifeAct::RFP and NMY-2::GFP. Merged image and the inset show their co-localization at the rachis surface. h Intensity line profile of the proteins obtained along the rachis surface show in the inset of (g). i Pearson’s coefficient of correlation (PCC) calculated between LifeAct::RFP and NMY-2::GFP by drawing a seven pixel line at the rachis bridge of the distal end of 30 different gonads. Scale bar, 10 µm

