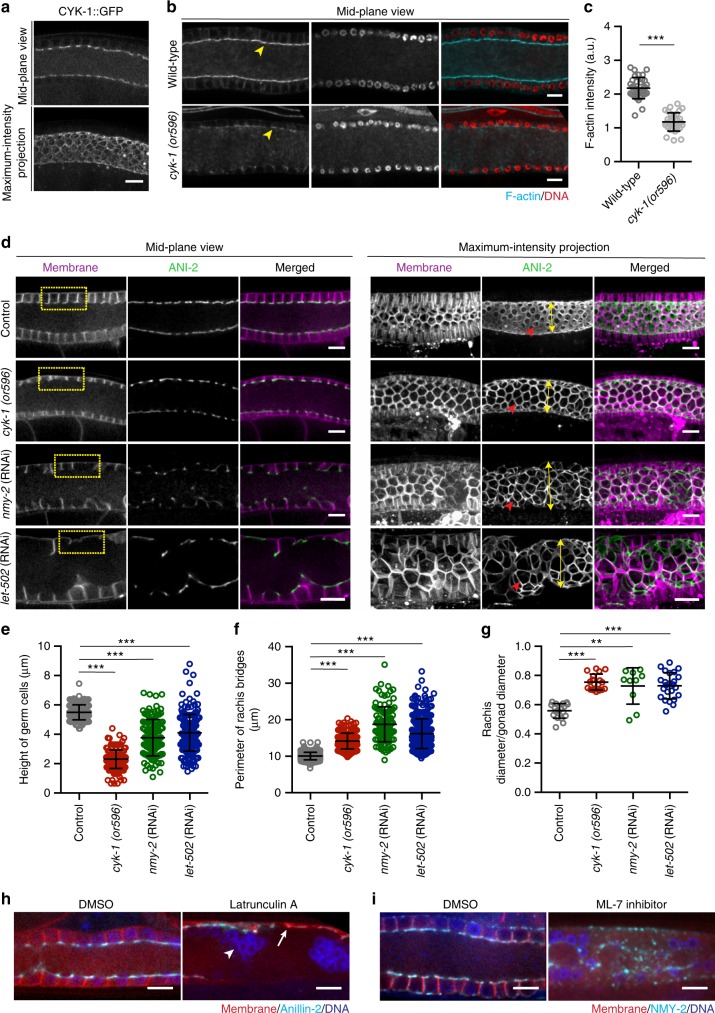
Fig. 3.
Loss of contractility results in shortening of germ cell membranes, increased intercellular bridge perimeter, and a wider rachis. a Confocal image of GFP labeled endogenous formin, CYK-1. b Phalloidin (cyan) and DAPI (red) stained gonads of wild-type and temperature-sensitive cyk-1(or596) mutants grown at semi-permissive temperature (20 °C). Yellow arrow heads show actin level in wild-type versus cyk-1(or596) mutants. c Quantification of actin intensity at rachis bridge in wild-type (N = 35) versus cyk-1(or596) mutants (N = 32). d Mid-plane and maximum-intensity projection views of the germline, expressing mCherry::PH (magenta) and GFP::ANI-2 (green). Reduced contractility was achieved by using cyk-1(or596) grown at 20 °C, or knockdown of non-muscle myosin-II (NMY-2), or Rho-binding Ser/Thr kinase, LET-502. Yellow rectangular boxes emphasize the height of germ cells. Red arrowheads highlight the difference in the perimeter of rachis bridge. Yellow double-headed arrows show the increase in rachis diameter. e Quantification of the height of germ cells in early meiotic region of the gonads of control (n = 203 membranes, N = 20), cyk-1(or596) at 20 °C (n = 200 membranes, N = 20), nmy-2(RNAi) (n = 120 membranes, N = 10) and let-502(RNAi) (n = 200 membranes, N = 20). f Quantification of the perimeter of rachis bridges in early meiotic region of the gonads of control (n = 250 bridges, N = 23), cyk-1(or596) at 20 °C (n = 215 bridges, N = 18), nmy-2(RNAi) (n = 105 bridges, N = 16), and let-502(RNAi) (n = 250 bridges, N = 22). g Quantification of rachis/gonad diameter in early meiotic region of the gonads of control (N = 18), cyk-1(or596) at 20 °C (N = 18), nmy-2(RNAi) (N = 10), and let-502 (RNAi) (N = 24). h Confocal image of the germline expressing mCherry::PH;GFP::ANI-2 treated with DMSO (control) (N = 5) and Latrunculin A, 5 µM (N = 5). White arrow represents collapse of membranes and white arrowhead show clumped nuclei. i Confocal image of the germline expressing PH::GFP; NMY-2::mKate injected with DMSO (control) (N = 9) and myosin light-chain kinase inhibitor (ML-7), 250 µM for 40 min (N = 6). A DNA marker (blue), Hoechst dye, was used as control for injection. Data represents mean ± s.d. of three independent experiments. Statistical analysis was done using Mann–Whitney U-test (c) and one-way ANOVA test (e–g) (**p < 0.005, ***p < 0.0001). N = number of gonads analyzed. Scale bar, 10 µm

