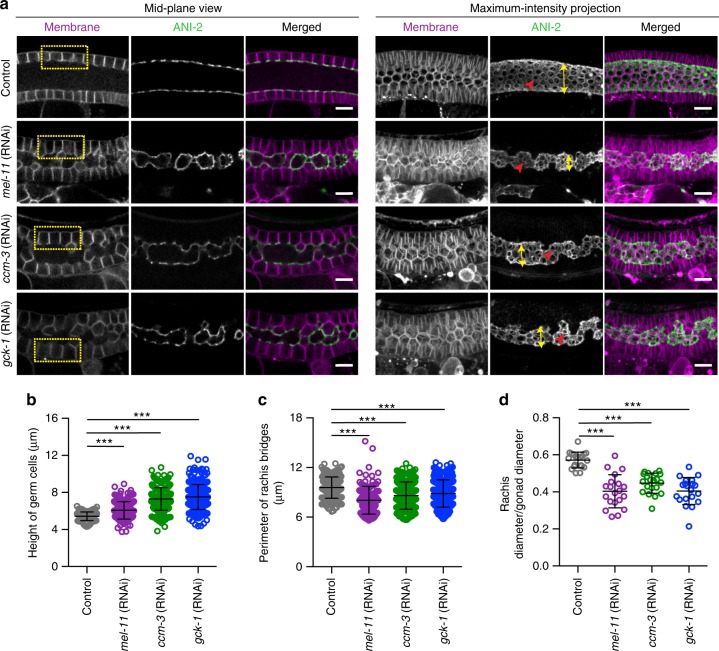
Fig. 4.
Excessive contractility results in taller germ cells, and overly constricted intercellular bridges and rachis. a Mid-plane and maximum intensity projection views of control, mel-11(RNAi), ccm-3(RNAi), and gck-1(RNAi) gonads expressing GFP::ANI-2 (green) and a membrane marker (magenta). Rectangular boxes (yellow) emphasize the increase in the height of germ cell membrane after knockdown. Red arrowheads highlight the difference in the perimeter of rachis bridges. Also the diameter of the rachis was reduced significantly in mel-11(RNAi), ccm-3(RNAi), and gck-1(RNAi) gonads (yellow double-headed arrow). b Quantification of the height of germ cells in the early meiotic region of the gonads of control (n = 102 membranes, N = 10 gonads), mel-11(RNAi) (n = 196 membranes, N = 20), ccm-3(RNAi) (n = 250 membranes, N = 25), and gck-1(RNAi) (n = 250 membrane, N = 25). c Quantification of the perimeter of rachis bridges in the early meiotic region of the gonads of control (n = 187 bridges, N = 20), mel-11(RNAi) (n = 125 bridges, N = 16), ccm-3 (RNAi) (n = 307 bridges, N = 23), and gck-1(RNAi) (n = 307 bridges, N = 21). d Quantification of rachis/gonad diameter in the early meiotic region of the gonads of control (N = 20), mel-11(RNAi) (N = 20), ccm-3(RNAi) (N = 20), and gck-1(RNAi) (N = 20). Error bars denotes s.d. Data represent mean ± s.d. of three independent experiments. Statistical analysis was done using one-way ANOVA test (***p < 0.0001). N = number of gonads analyzed. Scale bar, 10 µm

