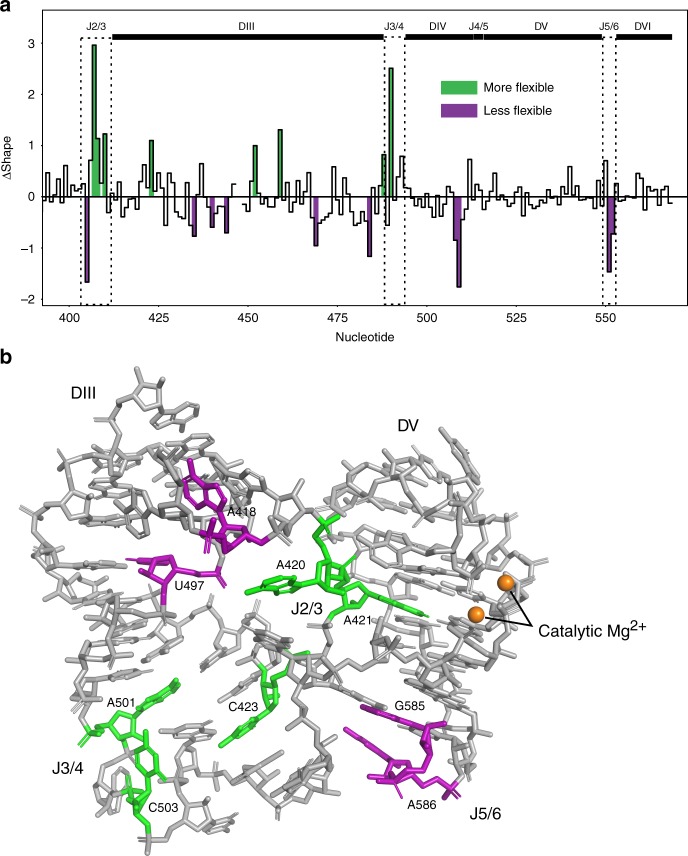
Fig. 6.
SHAPE-MaP analysis. a Differences in SHAPE reactivity compared between the pre-2s and post-catalytic states. Colored regions are nucleotides with significant reactivity differences (Z-factor > 0 and |standard score| ≥ 1 as determined by the algorithm and colored by the ΔSHAPE program). Green represents nucleotides that are more flexible in the post-catalytic form compared to the pre-2s state. Purple represents nucleotides that are less flexible in the post-catalytic compared to pre-2s. b Junction regions of the post-catalytic intron labeled with SHAPE difference data. Colors are the same as a. Only the basal stem of domain III is shown. The junction sequences are in close proximity to the catalytic Mg2+ ions

