Fig. 2.
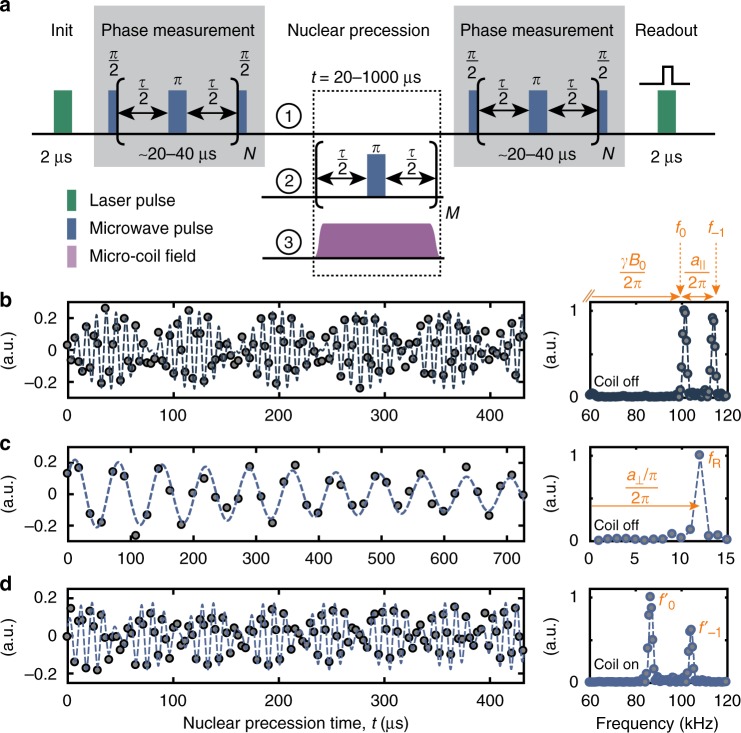
Implementation of three-dimensional localization spectroscopy. a Correlation spectroscopy protocol. By correlating two phase measurements we trace out the precession of the target nuclear spin(s) under different NMR sequences. Phase measurements are implemented by a Carr–Purcell–Meiboom–Gill (CPMG) train of microwave π pulses applied to the central electronic spin, where τ ≈ [2(f0 + f−1)]−1. Laser pulses are used to polarize and readout the electronic spin. Repetitions are N = 4–8 and M = t/τ. Experimental parameters for all measurements are collected in Supplementary Tables 2–9. b Free precession signal of the nuclear spin as a function of time t, using sequence 1. Right panel shows the corresponding power spectrum. The two frequencies f0 and f−1 are approximately equal to γnB0/(2π) and (γnB0 + a||)/(2π), respectively, see text. c Application of periodic π pulses on the NV center during t (sequence 2) causes a Rabi nutation of the nuclear spin, whose oscillation frequency fR is approximately equal to (a⊥/π)/(2π). d Activation of a transverse microcoil field ΔB during the nuclear precession (sequence 3) leads to shifted frequencies and . All measurements were conducted on 13C1. Extracted frequencies are listed in Table 1

