
Fig. 4.
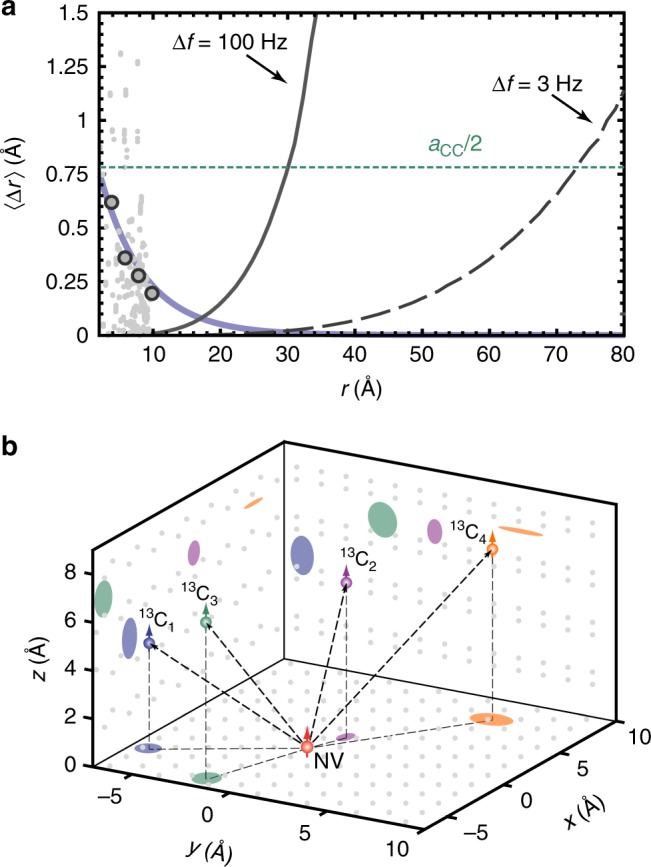
Three-dimensional localization of four 13C nuclear spins. a Average localization uncertainty 〈Δr〉 as a function of radial distance r to the central spin. Gray dots represent the systematic error of the point-dipole approximation (see text), extracted for all lattice sites reported in the DFT calculation of ref. 26. Blue curve is an exponential fit to the median values (gray circles) of the gray dots in intervals of 2 Å. Black curves show the uncertainty of the frequency measurement, assuming a precision of 100 Hz (solid line, this study) and of 3 Hz11, 38, 39 (dashed line). Dotted horizontal line is one-half the diamond C–C bond length of aC−C = 1.54 Å. b Reconstructed locations of the four distant nuclear spins 13C1–4. Shaded regions mark the 2σ-confidence area of the localization projected onto (xy, yz, xz)-planes of the coordinate system. Gray points represent carbon lattice positions projected onto the same planes. The origin is set to the expected center of gravity of the spin density at 2.29 Å from the nitrogen nucleus on the NV symmetry axis25, 26. Due to the inversion symmetry of the hyperfine interaction, our method cannot distinguish between sites in the upper and lower hemisphere; all 13C are therefore plotted in the upper hemisphere