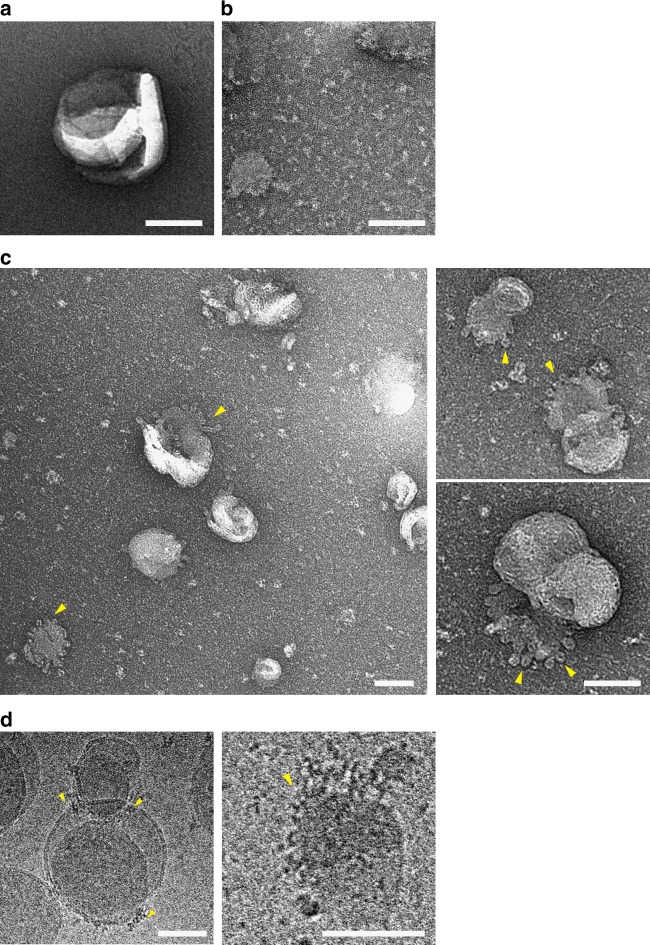
Fig. 5.
Electron-microscopic visualization of IFT172 with Folch fraction liposomes. a Negative-stain EM image of Folch fraction I liposomes as control. Scale bar: 100 nm b Negative-stain EM image of IFT172 (1 µM) with Folch fraction I liposomes (0.2 mM). Scale bar: 100 nm. The membrane became deformed into small pieces. c Negative-stain EM images of IFT172 (250 nM) with Folch fraction I liposomes (0.2 mM) showing the remodeling of the membrane surface by IFT172. Scale bar: 100 nm. Small (~20 nm) vesicles (yellow arrowheads) get pinched off from the membrane surface. d Cryo-EM images of IFT172 (500 nM) with Folch fraction I liposomes (0.4 mM). Scale bar: 100 nm

