
Figure 1.
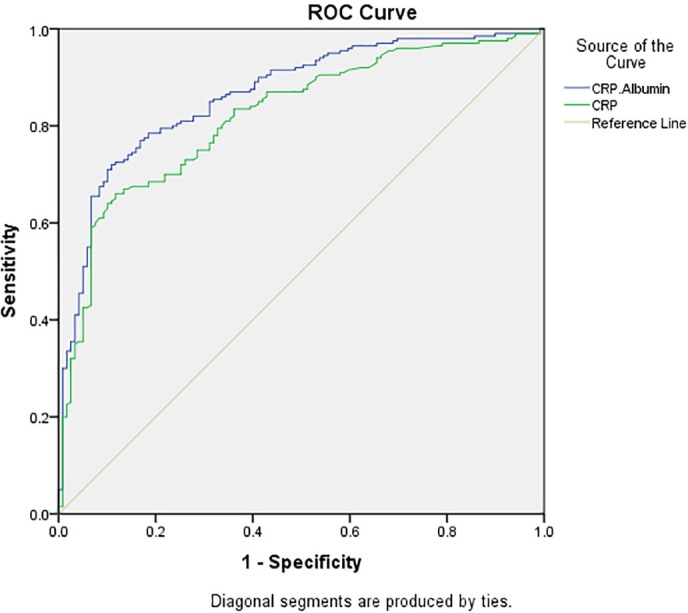
Receiver operating characteristic curve plotting the true positive rate against the false positive rate for CRP/albumin (blue line) and CRP (green line) in differentiating women with and without PCOS. The area under the curve for CRP/albumin: 0.865, 95% CI 0.824 to 0.905; for CRP 0.820, 95% CI 0.773 to 0.867. BMI, body mass index; CRP, C reactive protein; PCOS, polycystic ovary syndrome.