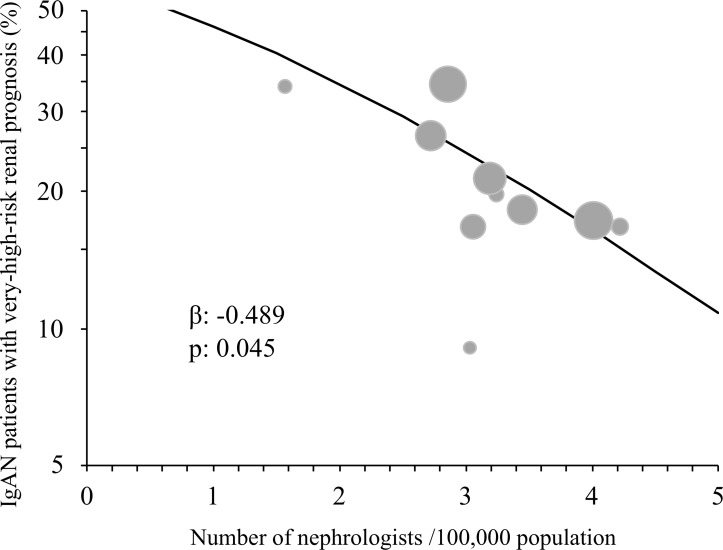
Figure 2.
Relationship between the rate of patients with IgA nephropathy (IgAN) with a very-high-risk renal prognosis and the number of nephrologists per regional population. Circles indicate each region and the areas of the circles are proportional to the regional populations. The rate of patients with IgAN with a very-high-risk renal prognosis in each region was adjusted by age, sex and hypertension. The regression line was obtained from the generalised linear mixed model in table 4.

