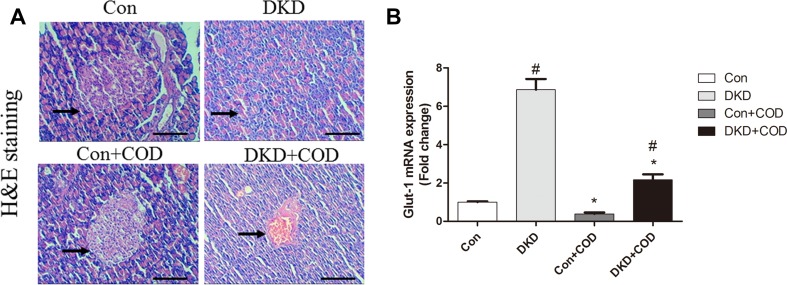
Fig. 4.
Effect of COD on pancreas and Glut-1 expression. The photomicrographs of H&E-stained sections (a) were obtained for the four groups on day 30 after COD treatment. Scale bar: 600 μm (×100). qPCR analysis of Glut-1 (b) expression in remnant kidney. All data were presented as the mean ± SD. ##p < 0.01, #p < 0.05 vs. Con group; **p < 0.01 vs. COD treatment (n = 6)

