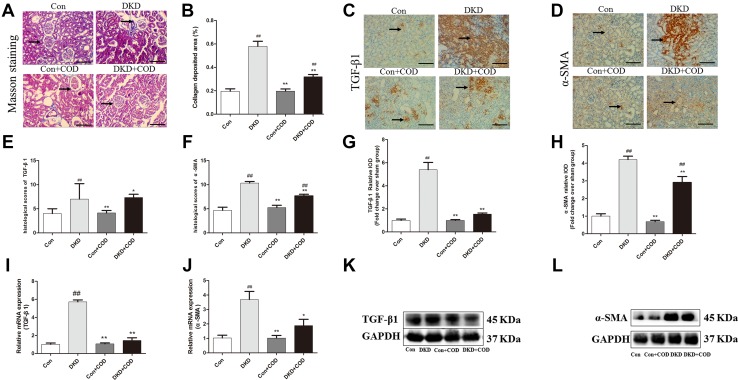
Fig. 7.
Effect of COD on inhibition of renal fibrosis and fibrosis markers in DKD rats. a The photomicrographs of Masson’s trichrome-stained kidney sections from the four experimental groups on day 30 after COD treatment. Scale bar: 600 μm (×200). b The collagen deposition area was assessed by Masson’s trichrome staining and was quantified using Image-Pro Plus 6.0 analysis software. The image and values are represented as mean ± SD. The expressions of TGF-β1 (c) and α-SMA (d) were determined by IHC staining in the kidney sections of rats from the four groups on day 30 after COD treatment. The histological score of TGF-β1 (e) and α-SMA (f) was evaluated in five horizons on a scale from 1 to 12: 0–3, negative (−); 4–6, low positive (+); 7–9, medium positive (++); and 9–12, strongly positive (+++). The quantitative determination of the renal TGF-β1 (g) and the α-SMA (h) protein content was performed using the Image-Pro Plus 6.0 software. The mRNA expressions of TGF-β1 (i) and α-SMA (j) were analyzed using qPCR in the remnant kidney. The proteins of TGF-β1 (k) and α-SMA (l) were examined by western blotting. All data were presented as the mean ± SD. ##p < 0.01; #p < 0.05 vs. Con group; *p < 0.05; **p < 0.01 vs. COD treatment (n = 6)

