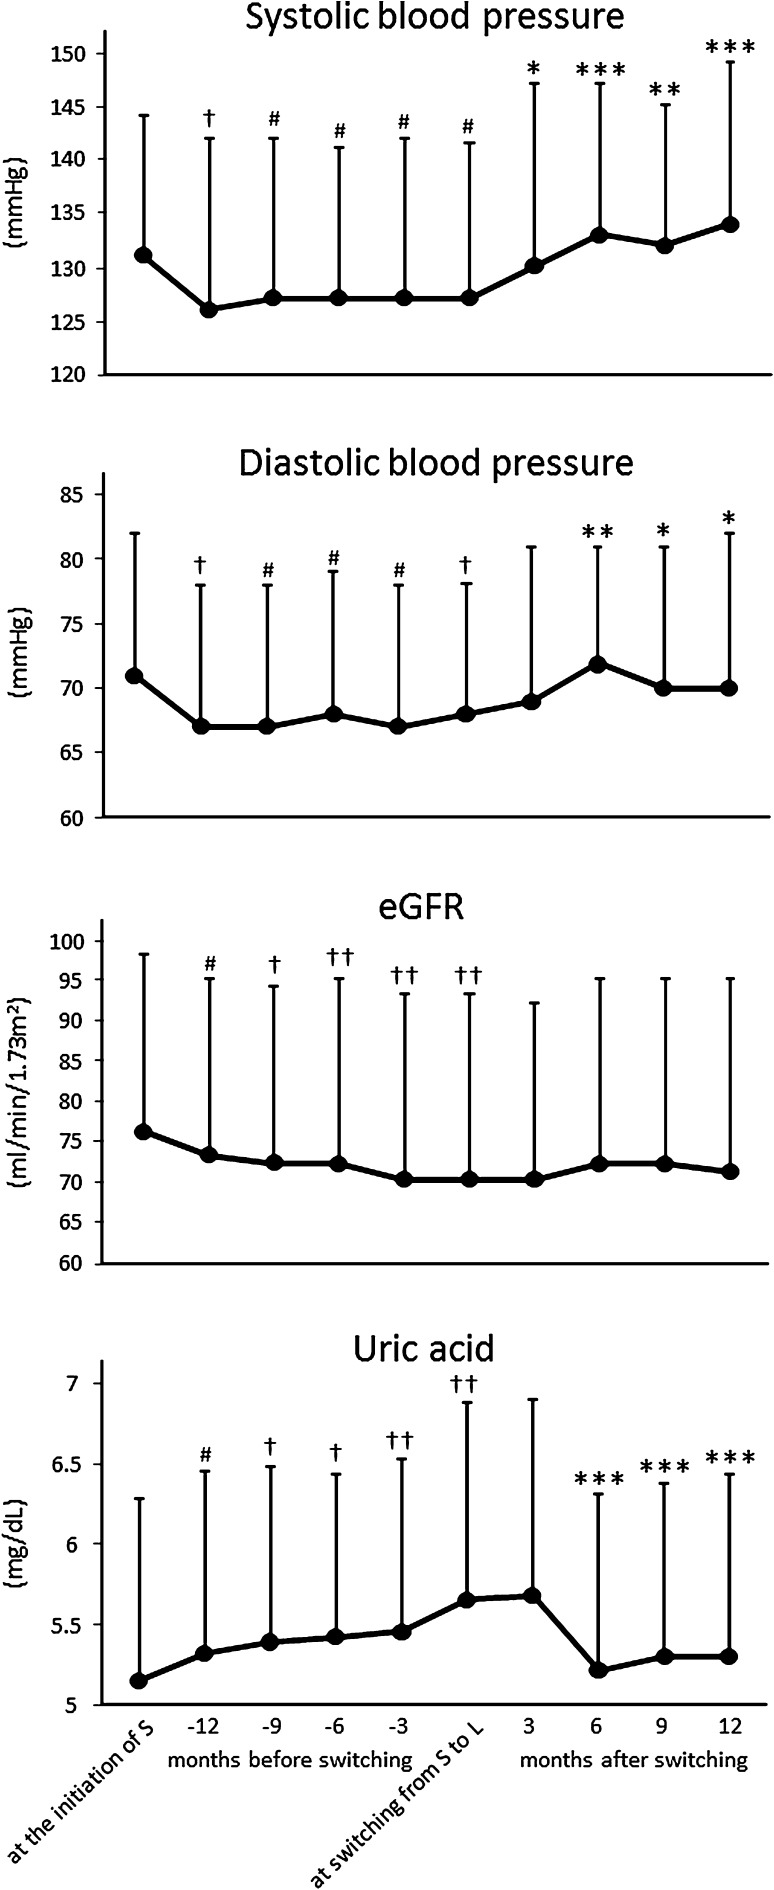
Fig. 1.
Changes in blood pressure, eGFR and serum uric acid concentration before and after switching from sitagliptin to linagliptin. Abbreviations are shown in the text. Data are expressed as mean ± SD. Repeated measures ANOVA with post hoc Bonferroni test was used for statistical analysis. *P < 0.05, **P < 0.01, ***P < 0.001 versus the value at switching from sitagliptin to linagliptin. # P < 0.05, † P < 0.01, †† P < 0.001 versus the value at the initiation of sitagliptin

