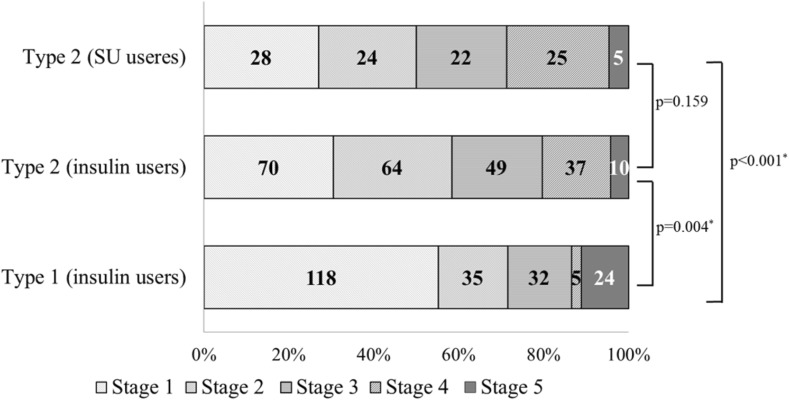
Fig. 5.
Proportion of stages of nephropathy among patients with diabetes mellitus by type of diabetes comparisons using the Bonferroni correction. All P values with the Chi square test for comparisons between patients with stage 1–2 and those with stages 3–5. *Refers to combinations shown to be significant at an alpha level of 0.05 in multiple comparisons using the Bonferroni correction

