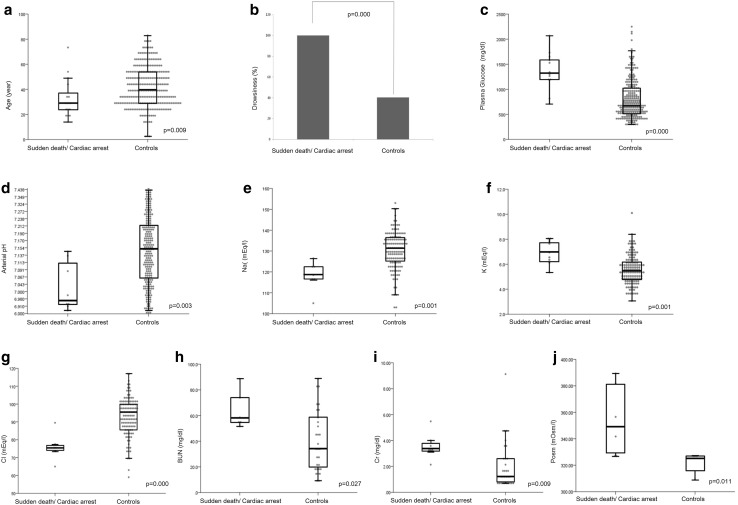
Fig. 1.
Scatter and box plots showing age (a), plasma glucose levels (c), arterial pH (d), sodium (e), potassium (f), chloride (g), serum blood urea nitrogen (h), serum creatinine (i), and plasma osmolality (j) at the onset of fulminant type 1 diabetes mellitus with and without sudden death or cardiac arrest. The bottom and top of each box show the first and third quartiles, and the band inside the box is the median. The ends of the whiskers represent the lowest datum within the 1.5 interquartile range of the lower quartile and the highest datum within the 1.5 interquartile range of the upper quartile. The bar graph (b) shows the percentage of the patients who presented drowsiness

