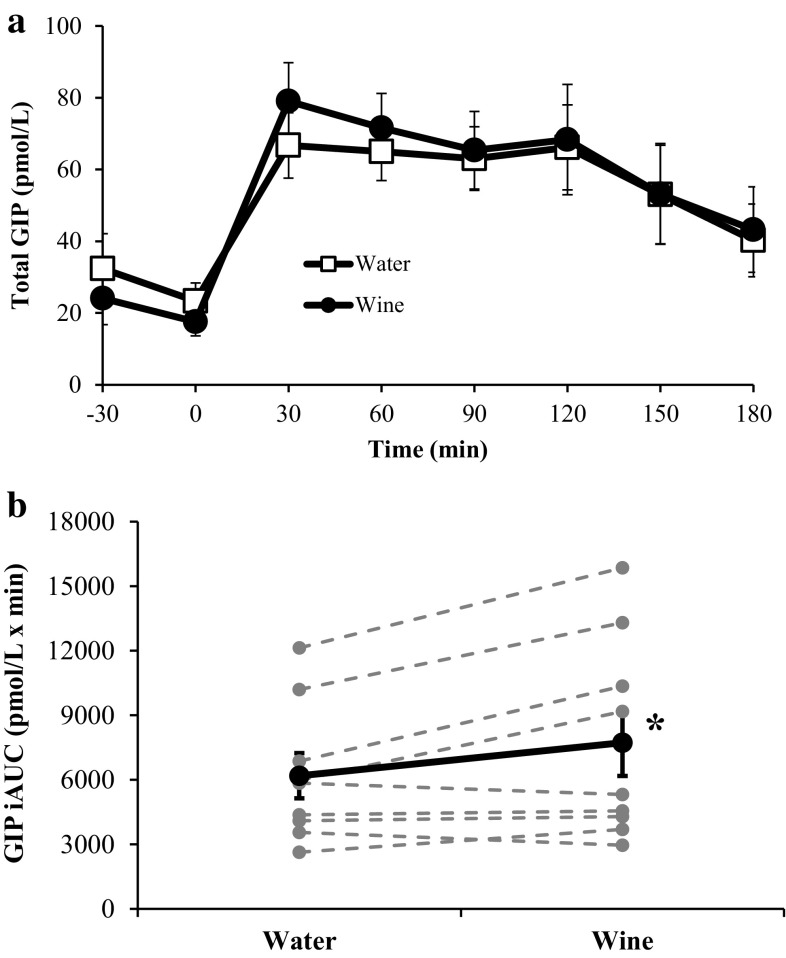
Fig. 4.
Plasma GIP concentrations before and during each OGTT (a) and the corresponding GIP iAUC values (b). In b, bold markers represent the mean values whereas gray markers represent individual responses. *GIP iAUC is significantly greater after treatment with red wine (p < 0.05). Data are expressed as mean ± SE

